New in WISQARS Data Visualization: Compare Injury Data
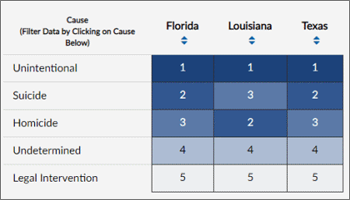
 WISQARS Data Visualization displays fatal injury data in an interactive, visual format. You can explore injury death data from 2001 to 2016. Now WISQARS Data Visualization provides new capabilities for comparing injury data:
- Compare different causes of death to understand their prevalence and rates.
- Compare injury-related death statistics across states.
- Compare injury data visually: Share insights and communicate findings in charts, graphs, and maps.
 Learn More


No hay comentarios:
Publicar un comentario