

Mortality Patterns Between Five States With Highest Death Rates and Five States With Lowest Death Rates: United States, 2017
Key FindingsData from the National Vital Statistics System, Mortality
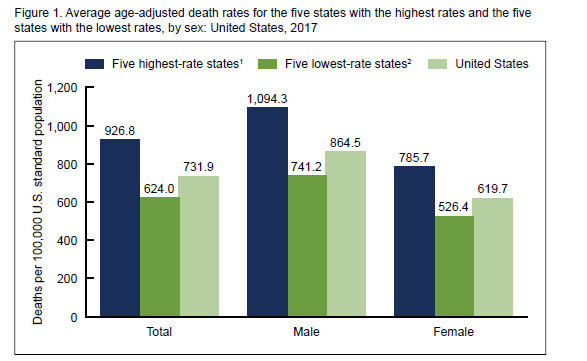
- The average age-adjusted death rate for the five states with the highest rates (926.8 per 100,000 standard population) was 49% higher than the rate for the five states with the lowest rates (624.0).
- Age-specific death rates for all age groups were higher for the states with the highest rates compared with the states with the lowest rates.
- Age-adjusted death rates were higher for non-Hispanic white and non-Hispanic black populations but lower for the Hispanic population in states with the highest rates than in states with the lowest rates.
- The age-adjusted death rates for chronic lower respiratory diseases and unintentional injuries for the states with the highest rates (62.0 and 65.5, respectively) were almost doubled compared with the states with the lowest rates (31.0 and 35.8).
Keywords
age-adjusted death rate, leading causes, health disparities, National Vital Statistics System
Full Report in HTML >
Mortality Patterns Between Five States With Highest Death Rates and Five States With Lowest Death Rates: United States, 2017Full Report in HTML >
Ways to Access Related Information & the National Vital Statistics System


.png)

.png)


No hay comentarios:
Publicar un comentario