AtlasPlus is:
- Convenient: you can get the data when you want – all with a few clicks.
- Quick: you don’t have to rely on someone else to compile and send you data.
- Easy: you don’t need to sift through pages of surveillance reports.
- Social: adding the AtlasPlus button to your website makes it even easier to access and share this powerful tool.
CDC’s National Center for HIV/AIDS, Viral Hepatitis, STD, and TB Prevention (NCHHSTP) has added 11 new indicators to NCHHSTP AtlasPlus that increase access to information on HIV and, for the first time, social determinants of health. AtlasPlus gives you quick access to more than 15 years of CDC’s surveillance data on HIV, viral hepatitis, sexually transmitted diseases (STDs), and tuberculosis (TB). Users can now view social and economic data in conjunction with HIV, viral hepatitis, STDs, and TB infections.
1. NEW Data
- Six new HIV indicators: estimated incidence, estimated diagnosed HIV among all persons living with HIV infection, and estimated persons living with HIV infection nationally and by state, and linkage to care, receipt of HIV medical care and viral suppression by state
- Five new social determinants of health indicators: poverty, uninsured, less than a high school education, and vacant housing nationally and by state and county; percentage of population living in rural areas nationally and by state; and county urbanization level
- 2016 surveillance data for HIV, viral hepatitis, STDs, and TB; 16 years of data are available for most variables
- Easy, quick access to the latest data by county, state, or US total
- On the new home page, users have easy and quick access to the latest diagnoses data for a specific state or the US
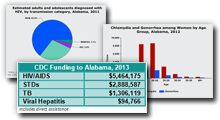
2. Diverse Visual Data Characterization Capabilities
- Line graphs by year
- Pie or bar charts for sex
- Bar charts for age group, race/ethnicity, transmission category (HIV), and country of birth (TB)
- Bar charts by states or by counties
- Ability to create two side-by-side maps or charts; e.g., compare two diseases, or one disease and one social determinants of health indicator
3. Enhanced data visualization
- Faster and cleaner data displays
- Change from flash format to HTML5, which means faster and cleaner data displays, as well as mobile access
- Significant upgrade to the Tables function; based on user feedback, we made it more intuitive to build tables based on the exact subset of the data you want to view
We heard you!
We incorporated many of the functions users told us that they use. For example, user favorites include:
- Integration of Disease and Social Determinants of Health Data
- Downloadable graphics and data
- Interactive and visually-engaging maps
We want to hear from you!
- Send us your thoughts through the Feedback button to we can keep improving the AtlasPlus experience.
- Have a question? Email us at NCHHSTPATLAS@cdc.gov


.png)


No hay comentarios:
Publicar un comentario