Health Disparities in Cancer
Some groups of people get cancer, or die from cancer, more often than other groups. These differences in health are called health disparities.
What Causes Health Disparities?
Many health disparities are related to social, behavioral, and environmental factors that put people at greater risk of cancer.
- Socioeconomic status (SES) measures a person’s education, income, and work status. For example, a person with a high SES may have a college degree, earn an above-average income, and have a full-time job that pays well. A person with a low SES may not have finished high school, doesn’t earn enough money to meet basic needs, and may be unemployed or have a low-paying job.
- Some behaviors can raise your risk of getting cancer, like smoking cigarettes, eating unhealthy food, intentional tanning, and not getting enough physical activity.
- The environment people live in also can affect their cancer risk. For example, safe neighborhoods that encourage walking can help people keep a healthy weight, which lowers their cancer risk.
People with a low SES often don’t have health insurance or a doctor and have trouble getting health care.
What Can Be Done to Reduce Disparities?
To reduce health disparities in cancer, everyone needs to be able to get cancer screening tests, high-quality treatment for cancer, and health care after cancer treatment. Making healthy choices can lower a person’s risk of getting cancer, or of having cancer come back after it has been treated.
Some Kinds of Health Disparities in Cancer
Groups of people with disparities in cancer may be defined by race, ethnicity, disability, gender and sexual identity, geographic location, income, education, or other characteristics. Examples of disparities are described below.
Race and Ethnicity
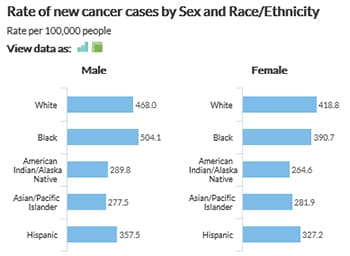
Some kinds of cancer are more common among certain racial or ethnic groups. For example—
- White and black women have similar rates of getting breast cancer, but black women have the highest rate of dying from it.
- Black men and women have the highest rates of getting, and dying from, colorectal (colon) cancer than any other group.
- Hispanic women have the highest rate of getting cervical cancer, but black women have the highest rate of dying from it.
- Black men have much higher rates of getting and dying from prostate cancer than men of any other group.
Living in a Rural Area
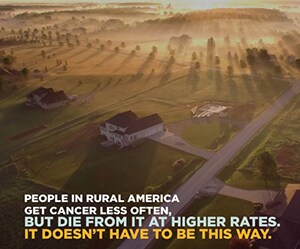 People who live in rural areas get cancer less often in general, but die from it more often. Those living in rural areas are more likely to get cancers linked to tobacco use (such as lung cancer), and those that have screening tests (such as colorectal and cervical cancers).1
People who live in rural areas are more likely to be poor than people who live in cities. They also are less likely to seek care because there are fewer health care providers. These issues mean that they may not get screening tests to find health problems early, or be educated about lifestyle changes to prevent future health problems.2
Disability
In the United States in 2014, about 9% of adults with any disability had ever had cancer, compared to about 5% of adults without any disability, according to CDC’s Disability and Health Data System.
People with disabilities are less likely than people without disabilities to get the health care they need. Doctor’s offices may not be accessible to them because of mobility issues, or they may not have transportation to the clinic. As a result, people with disabilities typically have lower cancer screening rates than people without disabilities, making it more likely that their cancer will be found later, when it is harder to treat.3
References
1Henley SJ, Anderson RN, Thomas CC, Massetti GM, Peaker B, Richardson LC. Invasive cancer incidence, 2004–2013, and deaths, 2006–2015, in nonmetropolitan and metropolitan counties—United States. MMWR Surveillance Summaries 2017;66(14):1–13.
2James CV, Moonesinghe R, Wilson-Frederick SM, Hall JE, Penman-Aguilar A, Bouye K. Racial/ethnic health disparities among rural adults—United States, 2012–2015. MMWR Surveillance Summaries 2017;66(23):1–9.
3Krahn GL, Walker DK, Correa-De-Araujo R. Persons with disabilities as an unrecognized health disparity population. American Journal of Public Health 2015;105 Suppl 2:S198–206.
More Information
- About Cancer Health Disparities (National Cancer Institute)


.png)


No hay comentarios:
Publicar un comentario