
Increasing Colorectal Cancer Screening in Health Care Systems Using Evidence-Based Interventions
ORIGINAL RESEARCH — Volume 15 — August 9, 2018
Amy DeGroff, PhD1; Krishna Sharma, PhD1; Anamika Satsangi, MPH1; Kristy Kenney, MPH1; Djenaba Joseph, MD1; Katherine Ross, MPH1; Steven Leadbetter, MS2; William Helsel, MS3; William Kammerer, BS3; Rick Firth, BS3; Tanner Rockwell, BA3; William Short, BS3; Florence Tangka, PhD1; Faye Wong, MPH1; Lisa Richardson, MD1 (View author affiliations)
Suggested citation for this article: DeGroff A, Sharma K, Satsangi A, Kenney K, Joseph D, Ross K, et al. Increasing Colorectal Cancer Screening in Health Care Systems Using Evidence-Based Interventions. Prev Chronic Dis 2018;15:180029. DOI: http://dx.doi.org/10.5888/pcd15.180029.
PEER REVIEWED
Introduction
Cancer is the second leading cause of death in the United States (1), and colorectal cancer (CRC) is the second leading cause of cancer death among cancers that affect both men and women (2). There is strong evidence that screening for CRC reduces incidence and mortality rates from the disease either by detecting cancer early, when treatments are more effective, or by preventing CRC through removal of precancerous polyps (3). The US Preventive Services Task Force recommends CRC screening for people at average risk (aged 50–75 y), using either stool-based tests (ie, fecal immunochemical test [FIT], fecal occult blood test [FOBT], multi-targeted stool DNA test [FIT-DNA]) or tests that directly visualize the colon (ie, colonoscopy, sigmoidoscopy, or computed tomographic colonography [CTC]) (3). Despite availability of these tests, a significant proportion of Americans remain unscreened; in 2016, only 67.3% of age-appropriate men and women were up to date with screening (4).
Although mortality rates from CRC have declined over time (5), disparities in incidence and mortality rates continue. In 2014, the most recent year for which data were available, the incidence of CRC among African Americans was 44.1 cases per 100,000, the highest rate among racial/ethnic groups (2). Similarly, the mortality rate of CRC among African Americans was 18.5 cases per 100,000, compared with 13.8 per 100,000 for whites (2). Disparities in incidence and mortality rates by socioeconomic factors, insurance status, and geographic areas are also well documented (6–8). With regard to CRC screening, disparities in screening persist with lower rates among people with low annual household income, with low educational attainment, and who are Hispanic/Latino (9). The National Colorectal Cancer Roundtable set an ambitious national target of 80% for CRC screening in the United States by 2018 (http://nccrt.org/).
The Colorectal Cancer Control Program (CRCCP), funded by the Centers for Disease Control and Prevention (CDC), aims to increase CRC screening rates among medically underserved populations (www.cdc.gov/cancer/crccp/index.htm). The CRCCP funds 23 states, 6 universities, and 1 tribal organization (Figure 1) to partner with health care systems and implement evidence-based interventions (EBIs) recommended by the Community Preventive Services Task Force in the Guide to Community Preventive Services (Community Guide) (10). CDC is leading a comprehensive, multiple methods evaluation to address a range of process, outcome, and cost-related questions. In this article, we present evaluation results for the CRCCP’s first program year (PY1), July 2015 through June 2016. Data were collected from October 2015 through April 2017.
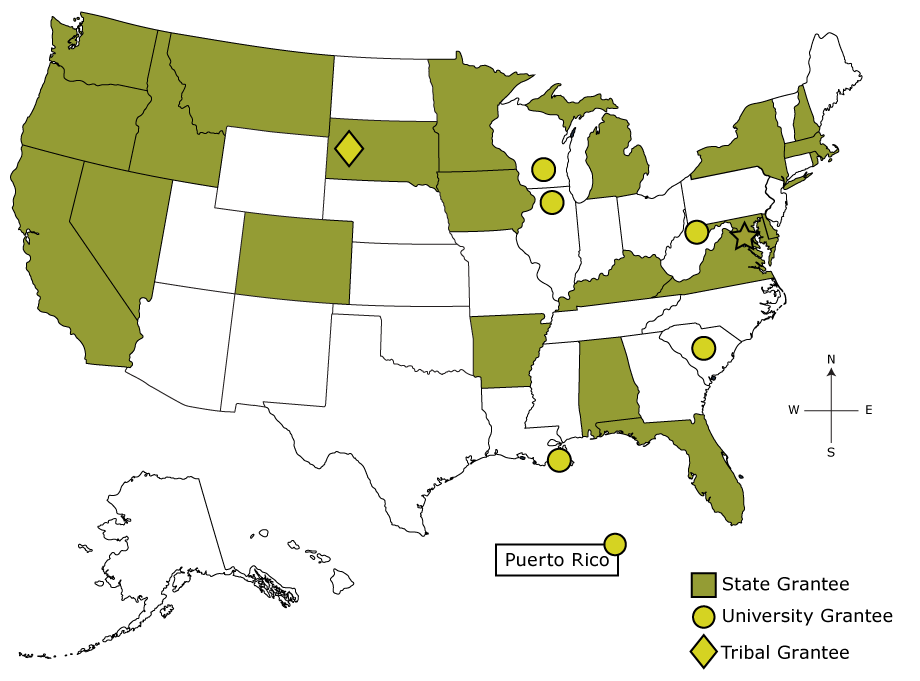
Figure 1.
Map Showing Grantees of CDC’s Colorectal Cancer Control Program, Program Year 1, July 2015 through June 2016. Abbreviation: CDC, Centers for Disease Control and Prevention. [A text description of this figure is available.]
Map Showing Grantees of CDC’s Colorectal Cancer Control Program, Program Year 1, July 2015 through June 2016. Abbreviation: CDC, Centers for Disease Control and Prevention. [A text description of this figure is available.]
There are 22 state grantees (Alabama State Department of Health, Arkansas Department of Health, California Department of Public Health, Colorado Department of Public Health and Environment, Delaware Department of Health and Social Services, District of Columbia Department of Health, Florida Department of Health, Idaho Department of Health and Welfare, Iowa Department of Public Health, Kentucky Cabinet for Health and Family Services, Louisiana State University Health Sciences Center, Mary Hitchcock Memorial Hospital [NH], Maryland Department of Health and Mental Hygiene, Massachusetts Department of Public Health, Michigan Department of Community Health, Minnesota Department of Health, Montana Department of Public Health and Human Services, Nevada Division of Public and Behavioral Health, New York State Department of Health, Oregon Health Authority, Rhode Island Department of Health, South Dakota Department of Health), 7 university grantees (University of Chicago, University of Puerto Rico, University of South Carolina, University of Wisconsin, Virginia Department of Health, Washington State Department of Health, West Virginia University), and 1 tribal grantee (Great Plains Tribal Chairmen’s Health Board).
Purpose and Objectives
CDC first funded the CRCCP from 2009 through 2015. In this earlier iteration, 22 states and 4 tribal grantees received funds to provide direct CRC screening services to low-income, uninsured, or underinsured populations known to have low CRC screening rates (11). Grantees contracted with primary care and gastroenterological providers to deliver recommended CRC screening tests. To a lesser degree, grantees implemented Community Guide–recommended EBIs with the goal of increasing population-level screening rates. Evaluation of this program focused on monitoring patient-level clinical service delivery, the types of EBIs implemented (12,13), costs (14,15), and changes in state-wide screening rates using data from the Behavioral Risk Factor Surveillance System (BRFSS). Evaluators found that program reach was insufficient to detect impact at the state level.
In response to the findings, CDC redesigned the CRCCP model and funded a new 5-year grant period beginning in 2015. Under the new model, grantees partner with primary care clinics to implement EBIs as well as supporting activities (SAs) such as health information technology (HIT) improvements to support population management for cancer screening. In contrast to the first CRCCP iteration in which the focus was primarily on individuals, changing to a health systems model increases public health impact because reach is extended (16). Grantees use public health data to identify and recruit primary care clinics serving low-income, high-need populations in their states. Under this new model, the clinic is the defined measurement unit, with clinic-level screening rates representing the primary outcome. CDC is conducting a comprehensive evaluation of the CRCCP to examine program processes, outcomes, and costs. The evaluation aims to support program improvement, strengthen accountability, and ensure sound policy decision making. In this article, we address 3 overarching evaluation questions:
- How many people are reached through the program?
- What EBI/SA activities are implemented by CRCCP grantees?
- Does the CRCCP contribute to improved screening rates in participating clinics?
Intervention Approach
In 2010, CDC and the Health Resources and Services Administration (HRSA) commissioned the National Academy of Medicine to convene experts and examine the integration of public health and primary care (17). The premise of the study was that capacity in both public health and primary care could be expanded, and meaningful improvements in population health, including disparity reduction, could be achieved through effective integration. The resulting report identified CRC screening as an area for collaboration between public health and primary care, given the potential alignment in the goals of the CDC’s CRCCP and HRSA’s federally qualified health centers (FQHCs). CRCCP’s priority population is served by FQHCs, and CRC screening rates in these clinics are often low. The national CRC screening rate in 2016 for FQHCs was 39.9% (18). In addition, HRSA recognized the importance of CRC screening and had recently introduced a new quality measure for CRC screening that FQHCs were required to report annually. These circumstances offered the opportunity for FQHCs and local public health agencies to collaborate and achieve greater increases in screening.
Along with public health and primary care integration, several tenets of effective public health implementation also support the CRCCP model (19). These include focusing on defined, high-need populations in which disease burden is highest; establishing partnerships to support implementation; implementing sustainable health system changes; using evidence-based strategies to maximize scarce public health resources; encouraging innovation in adaptation of EBIs/SAs; conducting ongoing, systematic monitoring and evaluation; and using data for program improvement and performance management.
The program logic model (Figure 2) reflects the activities, outputs, and short-term outcomes for the CRCCP. Along with health system clinics, grantees partner with organizations in their states such as primary care associations, the American Cancer Society, and organizations that can assist with implementation, evaluation, or both. Grantees are required to implement 2 or more EBIs identified in the Community Guide in each clinic (Table 1). CDC prioritizes 4 EBIs including patient reminders, provider reminders, provider assessment and feedback, and reducing structural barriers. Two SAs (ie, small media, patient navigation) can be implemented alongside the priority EBIs, and grantees are encouraged to conduct provider education and community outreach to link priority population members to clinical services. Grantees use HIT to integrate EBIs at the systems level (eg, provider receives an automated reminder via the electronic health record [EHR] while seeing a patient) and address issues that interfere with accurate screening rate measurement (eg, entering screening information in incorrect EHR fields) (20).
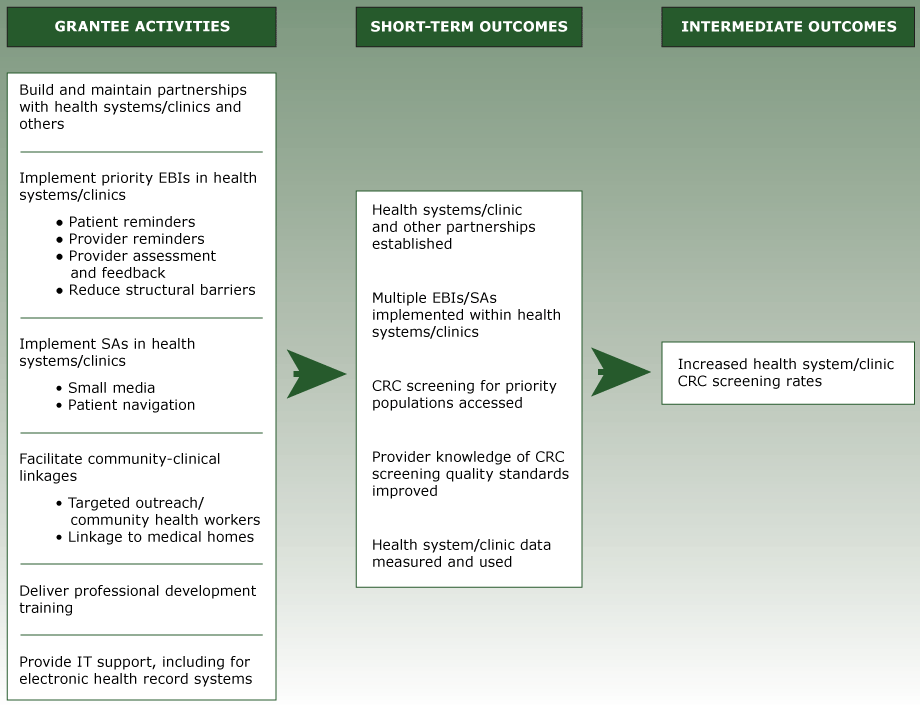
Figure 2.
Program Logic Model Showing Activities and Outcomes of the Colorectal Cancer Control Program, Program Year 1, Centers for Disease Control and Prevention, July 2015 through June 2016. Abbreviations: CRC, colorectal cancer; EBIs, evidence-based interventions; SAs, supporting activities. [A text description of this figure is available.]
Program Logic Model Showing Activities and Outcomes of the Colorectal Cancer Control Program, Program Year 1, Centers for Disease Control and Prevention, July 2015 through June 2016. Abbreviations: CRC, colorectal cancer; EBIs, evidence-based interventions; SAs, supporting activities. [A text description of this figure is available.]
Evaluation Methods
Using CDC’s Framework for Program Evaluation (21), we developed a comprehensive evaluation to assess processes and outcomes for the 5-year program period. The 6-step framework includes 1) engaging stakeholders, 2) describing the program, 3) focusing the evaluation design, 4) gathering credible evidence, 5) justifying conclusions, and 6) ensuring use and sharing lessons learned. Stakeholders, including CRCCP grantees, CDC staff, and health care experts, provided guidance throughout the evaluation planning process. The program logic model helped to describe the program and focus the evaluation design. In developing the evaluation plan, evaluators specified key questions and selected appropriate methods to address them. The multiple methods evaluation includes an annual grantee survey (Office of Management and Budget [OMB] control no. 0920–1074), a clinic-level data set (OMB control no. 0920–1074), case studies, cost studies, and use of secondary data (eg, financial reports). The description of methods centers on the collection, reporting, and analysis of clinic-level data presented in this article.
For the clinic data set, we developed a detailed data dictionary including record identification numbers, health system and clinic characteristics, patient population characteristics, screening rate measures, monitoring and quality improvement activities, and EBIs/SAs. Five grantees reviewed and provided feedback on the data dictionary. To support consistent and accurate reporting of clinic-level CRC screening rates, we developed Guide for Measuring Cancer Screening Rates in Health Systems Clinics (www.cdc.gov/cancer/crccp/guidance_measuring_crc_screening_rates.htm). The guide provides information for calculating and validating CRC screening rates using chart review–generated or EHR-generated rates. Grantees use 1 of the following 4 nationally recognized screening rate measures: 1) National Committee for Quality Assurance’s Healthcare Effectiveness Data and Information Set (HEDIS) (www.ncqa.org/hedis-quality-measurement), 2) HRSA’s Uniform Data System (UDS) (https://bphc.hrsa.gov/datareporting/), 3) Indian Health Service’s Government Performance and Results Act (www.ihs.gov/crs/gprareporting/), or 4) the National Quality Forum’s endorsed measure (www.qualityforum.org/Measures_Reports_Tools.aspx). Each measure has specifications for the numerator and denominator used to calculate the screening rate. The 4 options are provided to accommodate varying reporting requirements of grantees’ clinic partners (eg, FQHCs must report UDS screening rates to HRSA). For any given clinic, grantees must specify at baseline their selected CRC screening rate measure and 12-month measurement period (eg, calendar year). This same screening rate measure and measurement period must be used consistently for annual reporting. We encourage grantees to validate EHR-calculated screening rates using the chart review methods outlined in the guidance and, when appropriate, to partner with HIT experts to improve EHR data systems for monitoring and reporting CRC screening rates.
Baseline data are collected at the time a clinic is recruited for CRCCP participation. Annual data are reported each September following the end of the program year (July–June). This reporting provides CDC a longitudinal data set to examine EBI/SA implementation over time and assess changes in CRC screening rates. We developed spreadsheet-based forms, one each for clinic baseline and annual data. Grantees may use these forms to collect data directly from clinics or send the forms to clinic staff to complete and return. The forms incorporate validation features such as specified data ranges and drop-down response boxes (eg, primary CRC screening test type). The data collection tools were pilot-tested with 5 grantees for clarity, feasibility, and functionality.
Grantees use a web-based data reporting system, Clinic Baseline and Annual Reporting Systems (CBARS), developed by CDC’s data contractor, Information Management Services (IMS), to report clinic data to CDC. CBARS has built-in features to improve data quality including identifying missing data fields, flagging errors, and assessing discrepancies between historical and current responses. Data fields (eg, changes in clinic population size) can be updated at any time. Grantees were trained on the data variables, forms, and CBARS through CDC-led webinars. We provide on-going technical assistance to grantees and maintain a summary of frequently asked questions for use by grantees.
The clinic data can be divided into 3 categories: clinic characteristics, process implementation, and CRC screening rates. Clinic characteristics include clinic type, clinic size based on screening-eligible (ages 50–75 y) patient count, percentage of uninsured patients, primary CRC screening test type used by the clinic, availability of free fecal testing kits for patients, patient-centered medical home recognition, and rurality based on the US Department of Agriculture’s rural–urban continuum codes (22).
Process implementation variables include several related to EBI and SA activities. At baseline, grantees report whether each EBI/SA is in place before CRCCP implementation, regardless of the quality, reach, or level of functionality. Annually, grantees report whether the EBI/SA is in place at end of program year and whether CRCCP resources were used during the program year toward the EBI/SA. We define CRCCP resources as funds, staff time, materials, or contracts used to contribute to planning, developing, implementing, monitoring, evaluating, or improving an EBI/SA. If an EBI/SA was reported as not in place at the end of the program year, grantees report whether planning activities to implement the EBI/SA in the future were conducted. Analyzing these data allows CDC to assess whether CRCCP resources were used to implement a new EBI/SA in the program year (ie, EBI/SA was not in place at baseline), enhance an existing EBI/SA (ie, the EBI was in place at baseline and CRCCP resources were used to improve the EBI’s implementation during the program year), or plan for future implementation of the EBI/SA.
Other process implementation variables include the existence of a CRC screening policy and CRC clinic champion. A champion is an individual who takes a leadership role in a public health effort. Other variables include frequency of monitoring the CRC screening rate and frequency of implementation support provided to the clinic. Implementation support is defined as onsite or other (eg, telephone) contacts with the clinic to support and improve implementation activities for EBIs/SAs and CRC screening data quality.
The third category, CRC screening rates, includes the 12-month measurement period, screening rate measure used, numerator and denominator to calculate the screening rate, and if chart review is used, the percentage of charts extracted. Grantees also report a screening rate target for the upcoming program year.
We used descriptive analyses to summarize clinic characteristics and process implementation. We calculated a weighted average of baseline and annual screening rates across clinics, where weights were the clinic screen-eligible patient counts, the screening rate denominators reported at baseline and again at the end of PY1. Screening rate change was calculated as the difference between the weighted baseline screening rate and weighted PY1 screening rate. We calculated the number of patients screened at each clinic by multiplying the clinic screening rate by the respective screen-eligible patient count. Weighted screening rates and screened patient counts were determined by clinic characteristics (eg, rurality, size) and by process implementation status (eg, number of EBIs supported by CRCCP resources). All data analyses were conducted using SAS software, version 9.3 (SAS Institute Inc).
Results
In PY1, 29 of the 30 CRCCP grantees reported data for at least 1 clinic; 1 grantee did not recruit any clinics in PY1. A baseline and annual record was reported for each of 418 clinics. We excluded 5 clinics because grantees had terminated the partnership before the end of PY1, leaving a total of 413 clinics for analysis. Grantees reported baseline and PY1 annual screening rate data for 387 of the 413 (93.7%) clinics.
The 413 clinics represent 3,438 providers serving a CRC screening-eligible population of 722,925 patients. The recruited clinics represent 140 unique health systems. Of the 413 clinics, most were FQHCs or Community Health Centers (CHCs) (71.9%); certified patient centered medical homes (73.1%); and located in metro areas (72.4%). The clinics varied in size, with 27.4% of clinics serving fewer than 500 patients; 36.8% serving between 500 and 1,500 patients; and 35.8% serving more than 1,500 patients (Table 2). The proportion of uninsured patients within clinics also varied; 30.8% of clinics reported large uninsured patient populations (more than 20%). More than half (52.5%) used FIT/FOBT as their primary CRC screening test, and 28.8% had access to free fecal test kits. At baseline, many clinics had at least one EBI (87.9%) or SA (72.6%) already in place.
During PY1, grantees used CRCCP resources to implement new or to enhance EBIs in 95.2% of clinics. Patient reminder activities were supported most frequently (73.1%), followed by provider assessment and feedback (64.9%), reducing structural barriers (53.0%), and provider reminders (47.7%) (Table 3). All 4 EBIs were more often enhanced than implemented as a new activity. CRCCP resources were used less often to plan future EBI activities.
CRCCP resources were used toward SAs in 86.4% of clinics. Resources were used to support small media most frequently (69.0%), followed by provider education (57.6%) (Table 3). Only 11.6% of clinics used resources for supporting community health workers. However, nearly half of the clinics conducted planning activities for future implementation of community health workers (47.9%) and patient navigators (48.6%). Provider education was more often enhanced than newly implemented (42.4% vs 35.7%), as were patient navigators (31.5% vs 19.3%).
Most clinics reported having a CRC screening champion (78.7%) and a CRC screening policy (72.6%) in place at the end of PY1 (Table 4). Most clinics received implementation support from the CRCCP grantees on a weekly (12.3%) or monthly (77.7%) basis. Clinics monitored CRC screening rates at different intervals, including monthly (63.4%) or quarterly/semi-annually/annually (34.5%). Most clinics (73.1%) performed screening rate validation using chart review or other methods as part of CRCCP implementation.
Table 5 provides screening rates overall and by key clinic characteristics at baseline and PY1, as well as screening rate changes from baseline to PY1 for the 387 clinics reporting baseline and PY1 screening rates. A total of 640,086 patients were eligible for screening at baseline, and 631,634 patients were eligible at the end of PY1. The average screening rate increased during PY1 by 4.4 percentage points from baseline (42.9%) to PY1 (47.3%). The total number of patients up to date with CRC screening was 274,694 at baseline and 298,790 at the end of PY1, an increase of 24,096 patients, which represents 3.8% of the baseline eligible patient counts.
Baseline screening rates varied by clinic type. Health system/hospital clinics had a higher baseline screening rate (58.9%) than FQHCs/CHCs (36.5%), private/physician owned clinics (42.3%) or other primary care facilities (29.9%). During PY1, FQHCs/CHCs and other primary care facilities observed a larger increase in screening rates (5.4 and 10.8 percentage points, respectively), than health system/hospital clinics and private/physician owned clinics (2.6 and −0.8 percentage points, respectively).
Although rural clinics had the lowest average baseline screening rate at 38.3%, their screening rate during PY1 increased by 12.0 percentage points, higher than those of metro or urban clinics. The baseline screening rate was highest among large clinics (46.5%), followed by medium clinics (32.7%) and small clinics (28.0%). The average screening rate increase during PY1 was greatest among medium-sized clinics (7.7 percentage points) compared small and large clinics (1.2 and 4.0 percentage points, respectively).
Baseline screening rates and screening rate increases also varied by the proportion of clinic patients that were uninsured. Among clinics reporting their uninsured patient population, the baseline screening rate was lowest (38.7%) among clinics with a high uninsured patient population (more than 20%). However, clinics with 5% to 20% uninsured patients had the largest percent increase in screening (6.9 percentage points) during PY1. Among clinics reporting primary screening test type, clinics using FIT/FOBT observed greater screening rate increases (6.3 percentage points) than those clinics primarily using colonoscopy (2.7 percentage points). Clinics that reported having free fecal testing kits available for patients observed greater screening rate increases than those without (6.7 vs 3.6 percentage points).
Although PY1 screening rates varied by the number of EBIs newly implemented or enhanced in PY1, the highest screening rate increases were observed among clinics newly implementing or enhancing 3 or 4 EBIs (8.0 and 6.4 percentage points, respectively). Among clinics reporting their status of CRC screening champion or CRC screening policy in place at the end of PY1, clinics with a champion or screening policy reported greater increases in screening rates (4.9 and 5.5 percentage points, respectively) than clinics without them (0.7 and 1.5 percentage points, respectively).
Implications for Public Health
With the goal of increasing CRC screening and reducing disparities, the CRCCP integrates public health and primary care, implementing evidence-based strategies in clinics to achieve sustainable health systems change. Early results from our PY1 evaluation, including changes in screening rates, suggest the CRCCP is working; program reach was measurable and substantial, clinics enhanced EBIs in place or implemented new ones in clinics, and we observed an increase in the overall average screening rate.
Our data suggest that the CRCCP is reaching its intended population. At baseline, the screening rate was low, at only 42.9%, and nearly three-quarters of the 413 clinics were FQHCs/CHCs. Of interest, 92.5% of clinics were located in metro or urban areas. Baseline screening rates were lowest in rural clinics, and evidence indicates that death rates for CRC are highest among people living in rural, nonmetropolitan areas (23); therefore, expansion of the program to rural areas is important. The diversity observed in other clinic characteristics such as clinic size (patients aged 50–75 y) and percentage of uninsured patients was expected, given the varied and unique contexts in which grantees are operating. Reach will continue to expand as additional clinics participate in years 2 through 5.
Consistent with the new model, grantees committed CRCCP resources during PY1 toward EBI implementation in 95% of all participating clinics. However, less than 50% of clinics used CRCCP resources for provider reminders in PY1. Provider reminders can increase screening rates by a median of 15.3% (24). If reminders are integrated into an electronic health system, the activity is sustainable. Consequently, grantees could prioritize provider reminders for clinics where implementation is poor or not yet instituted.
Among the 387 clinics for which screening rate changes were calculated, 50.0% had either 3 or 4 EBIs in place at the end of the first program year. Using multiple EBIs that combine different approaches to increase community demand and access to cancer screening leads to greater effects (25). Grantees could be encouraged to newly implement or improve EBIs consistent with this finding. Interestingly, large numbers of clinics had EBIs in place at baseline, therefore, grantees more often expended CRCCP resources to enhance implementation of existing EBIs than establish new ones. That resources were used toward these existing EBIs suggests the potential importance of public health intervention to improve and scale up implementation of these activities. A case study is under way that will help us understand the ways in which EBIs are enhanced.
Grantees complemented EBI implementation with extensive SAs; CRCCP resources were used for SAs in more than 80% of clinics. Small media, which was used most often, can be distributed with patient reminders by community health workers and patient navigators to strengthen those strategies. Among the 181 clinics where CRCCP resources were used toward patient navigators, nearly 50% used them for planning rather than implementation, suggesting that new patient navigator programs may be started in PY2. Evidence indicates that patient navigation increases CRC screening (26–28).
In the first program year, the overall screening rate increased by 4.4 percentage points. The CRCCP’s PY1 overall screening rate of 47.3% is much lower than the commonly cited 67.3% from the 2016 BRFSS. These results again confirm that grantees are working with clinics serving the intended populations and also indicate the significant gap in CRC screening rates between those reached by the CRCCP and the US population overall. Among FQHCs/CHCs participating in the CRCCP, the screening rate increased by 5.4 percentage points in PY1, compared with 1.6 percentage points for FQHCs nationally during 2015–2016 (https://bphc.hrsa.gov/uds/datacenter.aspx?year=2015). Given that PY1 included several or more months dedicated to program start-up (eg, grantees putting contracts in place, hiring staff), the time for EBI/SA implementation was limited. Consequently, we may observe more substantial increases in screening rates going forward as interventions are in place for a longer period. At the same time, given that 52.5% of clinics primarily used FIT/FOBT tests, there is a challenge of ensuring annual rescreening to maintain current levels.
The screening rate changes observed during the CRCCP PY1 varied by clinic characteristics and other process implementation factors. For instance, clinics with champions and screening policies had higher screening rate increases than those without a champion or policy. Many public health studies have established that champions contribute to improved outcomes (29). Screening policies may be associated with more organized screening approaches in which higher screening rates are likely. Of note, clinics with 3 or more EBIs in place at the end of PY1 had higher screening rate increases than clinics with fewer EBIs, suggesting a possible dose effect. This is similar to what the Community Guide has reported (25). Longitudinal data will allow CDC to examine trends and better assess factors associated with screening rate changes.
The evaluation of federally funded programs in multiple US states is challenging, given the complexity and diversity of programs and strategic implementation in the unique environment of individual states. CDC’s evaluation approach addresses these challenges by working closely with grantees to collect clinic-level process and outcome data. Involving stakeholders, developing strong data collection and reporting systems, and communicating frequently with grantees have helped CDC institute a strong evaluation and better understand contextual factors that affect the data interpretation. Most importantly, the evaluation design allows CDC to track implementation progress and outcomes in a more timely fashion and make programmatic adjustments as needed.
We noted some limitations of this PY1 evaluation. First, some interventions were in place for less than a year, given the time needed to start programs. Second, EHRs often needed improvements to produce accurate screening rates at the population level, leaving room for further improvements in the accuracy and reliability of screening rate measurement. Technical assistance provided to clinics played a crucial role in improving their capacity to report quality data. Third, given real-world program implementation, we cannot isolate the effects of factors, such as temporal trends in CRC screening, on clinic screening rates. However, future years of longitudinal data will help identify factors associated with screening rate changes. Finally, improvement of screening delivery was beyond the scope of this evaluation.
Other aspects of our evaluation are under way. CDC is completing qualitative case studies with a subset of grantees to learn more about implementation, including how EBIs/SAs are selected and prioritized. An economic study of program implementation with 11 of the CRCCP grantees is in progress. The study will provide valuable information about costs and return on investment of the chosen EBIs. Sustainability of public health activities is essential to achieving long-term health outcomes. Therefore, CDC is examining whether the CRCCP model leads to sustained process and outcomes after CRCCP resources end. In particular, we are assessing whether EBIs/SAs become institutionalized health systems changes within the partner clinics without having to rely on CRCCP resources. When intervention sustainability is achieved, grantees could redirect CRCCP resources to additional clinic sites, leading to expanded reach and impact of the program.
The CRCCP shows promise, as evidenced by PY1 results. Grantees have collaborated with more than 400 clinics, integrating public health interventions in primary care settings by implementing EBIs/SAs and increasing CRC screening rates. The frequency of implementation support provided to clinics, screening rate monitoring, and screening rate validation suggest substantial engagement between grantees and clinics and may reflect a high intensity of CRCCP process implementation contributing to outcomes. We anticipate increasing reach over time as EBIs are sustained, allowing program resources to be shifted to additional clinics. Rural clinics, where screening rates were especially low, are an area for expansion. Early evaluation results suggest that several factors may support greater screening rate increases including implementing multiple EBIs, making free FOBT/FIT kits available, engaging a clinic champion, and having a CRC screening policy in place. CDC’s support may also improve EHR data capture to achieve more accurate measurement of screening outcomes. Integrating evidence-based public health activities in primary care settings can help achieve needed increases in CRC screening among underserved populations.
Acknowledgments
The authors thank CRCCP grantees and colleagues in the Program Services Branch for their support of the evaluation. No financial support was received for this study. No copyrighted materials were used in this manuscript.
Author Information
Corresponding Author: Amy DeGroff, PhD, Division of Cancer Prevention and Control, National Center for Chronic Disease Prevention and Health Promotion, Centers for Disease Control and Prevention, 4770 Buford Hwy NE, Mail Stop K-76, Atlanta, GA 30341. Telephone: 770-488-2415. Email: adegroff@cdc.gov.
Author Affiliations: 1Division of Cancer Prevention and Control, National Center for Chronic Disease Prevention and Health Promotion, Centers for Disease Control and Prevention, Atlanta, Georgia. 2Diversified Business Consulting Group, Inc, Silver Spring, Maryland. 3Information Management Services, Inc, Calverton, Maryland.
References
- Wang H, Naghavi M, Allen C, Barber RM, Bhutta ZA, Carter A, et al. ; GBD 2015 Mortality and Causes of Death Collaborators. Global, regional, and national life expectancy, all-cause mortality, and cause-specific mortality for 249 causes of death, 1980-2015: a systematic analysis for the Global Burden of Disease Study 2015. Lancet 2016;388(10053):1459–544. CrossRefPubMed
- US Cancer Statistics Working Group. United States cancer statistics: 1999–2014 incidence and mortality web-based report. Atlanta (GA): US Department of Health and Human Services, Centers for Disease Control and Prevention, National Cancer Institute; 2017. http://www.cdc.gov/uscs. Accessed December 18, 2017.
- US Preventive Services Task Force. Final update summary: colorectal cancer screening. http://www.uspreventiveservicestaskforce.org/Page/Document/UpdateSummaryFinal/colorectal-cancer-screening. Accessed December 18, 2017.
- Centers for Disease Control and Prevention. Behavioral Risk Factor Surveillance System. http://www.cdc.gov/brfss/index.html. Accessed December 18, 2017.
- Mokdad AH, Dwyer-Lindgren L, Fitzmaurice C, Stubbs RW, Bertozzi-Villa A, Morozoff C, et al. Trends and patterns of disparities in cancer mortality among US counties, 1980–2014. JAMA 2017;317(4):388–406. CrossRef PubMed
- Tawk R, Abner A, Ashford A, Brown CP. Differences in colorectal cancer outcomes by race and insurance. Int J Environ Res Public Health 2015;13(1):48. CrossRef PubMed
- Pulte D, Jansen L, Brenner H. Social disparities in survival after diagnosis with colorectal cancer: Contribution of race and insurance status. Cancer Epidemiol 2017;48:41–7. CrossRefPubMed
- Wong SL. Medically underserved populations: disparities in quality and outcomes. J Oncol Pract 2015;11(3):193–4. CrossRef PubMed
- White A, Thompson TD, White MC, Sabatino SA, de Moor J, Doria-Rose PV, et al. Cancer Screening Test Use – United States, 2015. MMWR Morb Mortal Wkly Rep 2017;66(8):201–6.CrossRef PubMed
- Community Preventive Services Task Force. The Guide to Community Preventive Services. https://www.thecommunityguide.org/. Accessed June 30, 2017.
- Joseph DA, DeGroff AS, Hayes NS, Wong FL, Plescia M. The Colorectal Cancer Control Program: partnering to increase population level screening. Gastrointest Endosc 2011;73(3):429–34.CrossRef PubMed
- Hannon PA, Maxwell AE, Escoffery C, Vu T, Kohn M, Leeman J, et al. Colorectal Cancer Control Program grantees’ use of evidence-based interventions. Am J Prev Med 2013;45(5):644–8.CrossRef PubMed
- Maxwell AE, Hannon PA, Escoffery C, Vu T, Kohn M, Vernon SW, et al. Promotion and provision of colorectal cancer screening: a comparison of colorectal cancer control program grantees and nongrantees, 2011–2012. Prev Chronic Dis 2014;11:140183. CrossRef PubMed
- Tangka FKL, Subramanian S, Hoover S, Royalty J, Joseph K, DeGroff A, et al. Costs of promoting cancer screening: Evidence from CDC’s Colorectal Cancer Control Program (CRCCP). Eval Program Plann 2017;62:67–72. CrossRef PubMed
- Subramanian S, Tangka FKL, Hoover S, Royalty J, DeGroff A, Joseph D. Costs of colorectal cancer screening provision in CDC’s Colorectal Cancer Control Program: Comparisons of colonoscopy and FOBT/FIT based screening. Eval Program Plann 2017;62:73–80. CrossRef PubMed
- Frieden TR. A framework for public health action: the health impact pyramid. Am J Public Health 2010;100(4):590–5. CrossRef PubMed
- Institute of Medicine. Primary care and public health: exploring integration to improve population health. Washington (DC): The National Academies Press; 2012.
- Health Resources Service Administration. Table 6B: quality of care measures. https://bphc.hrsa.gov/uds/datacenter.aspx?q=t6b&year=2016&state. Accessed June 5, 2018.
- Frieden TR. Six components necessary for effective public health program implementation. Am J Public Health 2014;104(1):17–22. CrossRef PubMed
- Use of electronic medical records to facilitate colorectal cancer screening in community health centers. Deerfield (IL): Aeffect Inc; 2013. http://nccrt.org/wp-content/uploads/NCCRT-Summary-EMR-Report-Final.pdf. Accessed December 18, 2017.
- Centers for Disease Control and Prevention. Framework for program evaluation in public health. MMWR Recomm Rep 1999;48(RR-11):1–40. PubMed
- US Department of Agriculture. Rural–urban continuum codes. https://www.ers.usda.gov/data-products/rural-urban-continuum-codes/. Accessed June 5, 2018.
- Henley SJ, Anderson RN, Thomas CC, Massetti GM, Peaker B, Richardson LC. Invasive cancer incidence, 2004–2013, and deaths, 2006–2015, in nonmetropolitan and metropolitan counties — United States. MMWR Surveill Summ 2017;66(14):1–13. CrossRef PubMed
- Baron RC, Melillo S, Rimer BK, Coates RJ, Kerner J, Habarta N, et al. ; Task Force on Community Preventive Services. Intervention to increase recommendation and delivery of screening for breast, cervical, and colorectal cancers by healthcare providers a systematic review of provider reminders. Am J Prev Med 2010;38(1):110–7. CrossRef PubMed
- US Preventive Services Task Force. Cancer screening: multi-component interventions — colorectal cancer screening 2017. https://www.thecommunityguide.org/findings/cancer-screening-multicomponent-interventions-colorectal-cancer. Accessed December 18, 2017.
- Honeycutt S, Green R, Ballard D, Hermstad A, Brueder A, Haardörfer R, et al. Evaluation of a patient navigation program to promote colorectal cancer screening in rural Georgia, USA. Cancer 2013;119(16):3059–66. CrossRef PubMed
- DeGroff A, Schroy PC 3d, Morrissey KG, Slotman B, Rohan EA, Bethel J, et al. Patient navigation for colonoscopy completion: results of an RCT. Am J Prev Med 2017;53(3):363–72. CrossRefPubMed
- Rice K, Gressard L, DeGroff A, Gersten J, Robie J, Leadbetter S, et al. Increasing colonoscopy screening in disparate populations: results from an evaluation of patient navigation in the New Hampshire Colorectal Cancer Screening Program. Cancer 2017;123(17):3356–66. CrossRef PubMed
- Durlak JA, DuPre EP. Implementation matters: a review of research on the influence of implementation on program outcomes and the factors affecting implementation. Am J Community Psychol 2008;41(3-4):327–50. CrossRef PubMed


.png)


No hay comentarios:
Publicar un comentario