NCHS Data Brief
Number 77, November 2011
Physician Assistant and Advance Practice Nurse Care in Hospital Outpatient Departments: United States, 2008–2009
On This Page
- Key findings
- Are PAs and APNs providing more care at visits to hospital OPDs?
- Does PA/APN utilization differ by selected hospital characteristics?
- Does PA/APN utilization differ by hospital location?
- In which types of clinics are PAs and APNs practicing?
- What types of visits were seen by PAs or APNs?
- Does the type of provider seen vary by patient characteristics?
- Summary
- Definitions
- Data source and methods
- About the authors
- References
- Suggested citation
 (765 KB)
Esther Hing, M.P.H. and Sayeedha Uddin, M.D., M.P.H.
Key findings
- Hospital outpatient department visits attended only by physician assistants (PAs) or advance practice nurses (APNs) increased by 50% from 2000–2001 (10%) through 2008–2009 (15%).
- The more urban the hospital location, the lower the percentage of visits seen only by PAs or APNs; decreasing from 36% in nonmetropolitan areas to 6% in large central metropolitan areas.
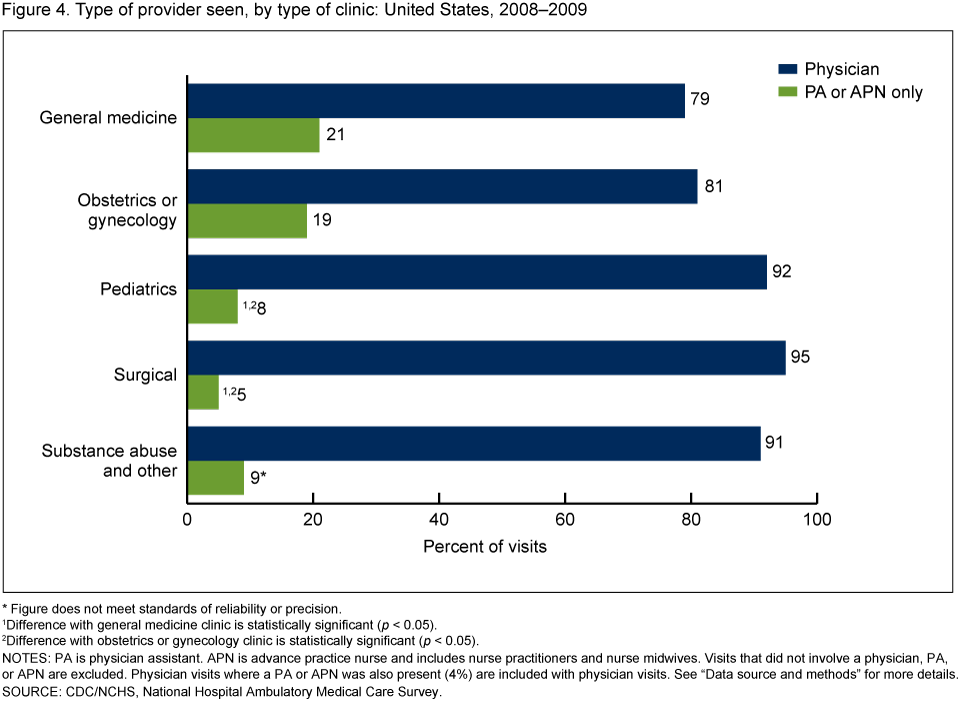
- A higher percentage of PA- or APN-only visits were to general medicine (21%) and obstetric or gynecology (19%) clinics compared with pediatric (8%) and surgical (5%) clinics.
- PAs and APNs saw a higher percentage of visits where a new problem was the major reason for the visit (22%) compared with visits for a chronic condition [routine (11%) or flare-up (14%)], or pre- or postsurgery care (6%).
Keywords: nonphysician clinicians • hospital outpatient department visits
Are PAs and APNs providing more care at visits to hospital OPDs?
- Between 2000–2001 and 2008–2009, the percentage of hospital OPD visits seen only by a PA or APN increased from 10% to 15% of OPD visits, while the percentage of joint physician/nonphysician clinician visits remained about 3% (Figure 1).
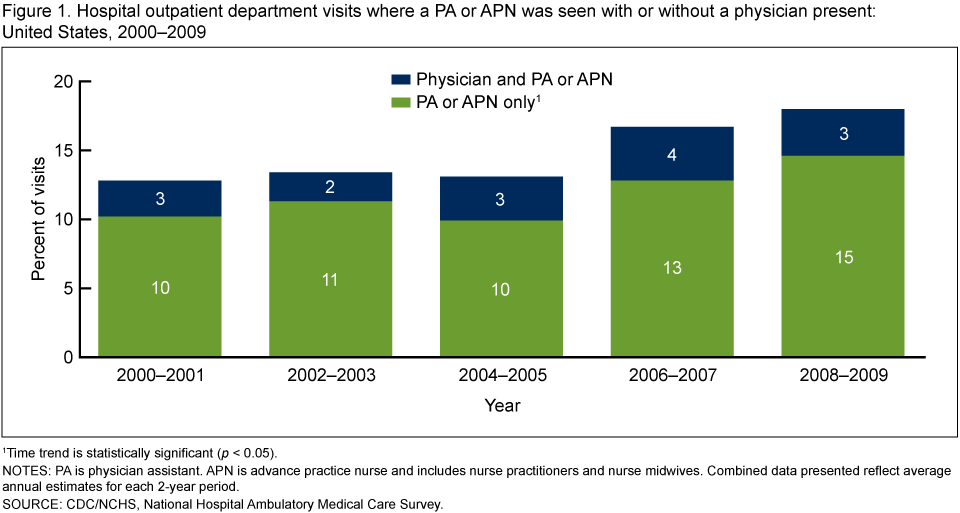
- Three-fourths of 103,010,000 hospital OPD visits in 2008–2009 were seen by a physician and 18% were seen by a PA or APN (4,5). Among visits to PAs or APNs, 65% were seen by an APN and 35% were seen by a PA (data not shown).
- During the same time period, the percentage of OPD visits attended only by physicians declined from 77% in 2000–2001 to 72% in 2008–2009 (data not shown).
- The percentage of visits not seen by a physician, PA, or APN remained the same (10%) and was excluded from the analyses that follow.
Does PA/APN utilization differ by selected hospital characteristics?
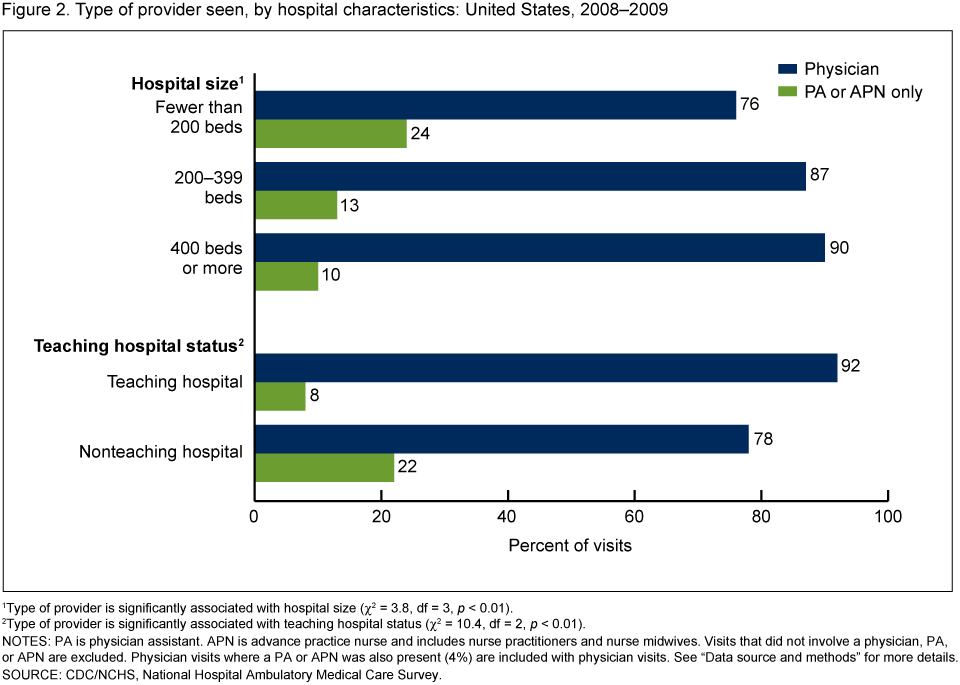
- The percentage of visits attended only by a PA or APN decreased as hospital size (number of beds) increased, from 24% among OPDs in hospitals with under 200 beds to 10% among hospitals with 400 or more beds.
- The percentage of visits seen only by a PA or APN was higher in nonteaching hospital OPD clinics (22%) than in teaching hospital OPD clinics (8%) (Figure 2).
Does PA/APN utilization differ by hospital location?
- The percentage of visits seen solely by a PA or APN decreased as the hospital's location became increasingly more urban: from 36% in nonmetropolitan areas to 6% in large central metropolitan areas (Figure 3).

In which types of clinics are PAs and APNs practicing?
- The percentage of visits seen only by a PA or APN was higher in general medicine (21%) and obstetrics and gynecology (19%) clinics than in pediatric (8%) and surgical (5%) clinics (Figure 4).
What types of visits were seen by PAs or APNs?
- PAs and APNs saw a higher percentage of visits where a new problem was the major reason for the visit (22%) compared with visits for a chronic condition [routine (11%) or flare-up (14%)], or pre- or postsurgery care (6%) (Figure 5).
- PAs and APNs saw a higher percentage of preventive care visits (17%) compared with visits for a routine chronic condition or pre- or postsurgery care.
- The percentage of visits seen only by a PA or APN was higher in OPD clinics reported to be the patients' primary care provider (22%) than in those clinics not identified as the patients' primary care provider (13%).
 A
ADoes the type of provider seen vary by patient characteristics?
- A higher percentage of visits made by younger patients were seen only by PAs or APNs (19%) than were older patients (13%). This pattern was observed regardless of patient gender (see Table).
- A lower percentage of visits by non-Hispanic black patients (12%) than non-Hispanic white patients (18%) were seen solely by a PA or APN.
- PAs and NPs saw significantly higher percentages of visits by patients with Medicaid or the Children's Health Insurance Plan (18%) or no insurance (22%) compared with visits made by Medicare patients (12%).
Summary
This analysis shows that visits to PAs or APNs have become more common in hospital OPDs over the past decade. Several of the 2008–2009 findings are consistent with previous studies. For example, visits seen only by a PA or APN continue to be higher in rural areas (6,7). In addition, a higher proportion of visits to PAs or APNs occur with younger patients (7).This analysis uncovered some new findings about PAs or APNs in hospital OPDs. Visits to PAs or APNs are more common in nonteaching hospitals and in smaller hospitals. General medical and obstetrics or gynecology clinics have higher percentages of PA or APN visits than either pediatric or surgery clinics. PAs or APNs in hospital OPDs provide services to patients for whom the clinic serves as a primary care provider and for assessing new problems or provision of preventive care.
PAs or APNs are providing an increasing share of care delivered in OPDs compared with the previous decade. The findings in this report suggest that PAs or APNs continue to provide a critical health care function by providing care in settings with fewer physicians, such as rural locations, small hospitals, and nonteaching hospitals.
Definitions
APN: Refers to an RN with advanced training in areas not usual for RNs, such as diagnosing and managing common diseases, ordering tests, and prescribing medications. Although there are several types of APNs, most APNs who work in OPDs are nurse practitioners or nurse midwives. Therefore, in this report, the term APN refers specifically to NPs or NMs. Among the two types of APNs not included in this report [nurse anesthetists (NAs) and clinical nurse specialists (CNSs)], 82% of NAs and 49% of CNSs worked in hospital settings in 2008 (3). Nationwide, NAs comprised 13% and CNSs comprised 23% of all APNs in 2008 (3).Hospital outpatient department: Refers to a hospital facility where nonemergent ambulatory medical care is provided under the supervision of a physician.
Hospital size: Refers to the number of inpatient beds as recorded in SDI Market Profile Database.
Teaching hospital: Refers to a hospital that provides clinical education and training to current and future doctors, nurses, and other health professionals, in addition to delivering medical care to patients. Information on teaching hospital status is from SDI Market Profile Database.
Urban or rural classification of the hospital's ZIP code: Developed by the Centers for Disease Control and Prevention's (CDC) National Center for Health Statistics (NCHS) to study the association between urbanicity and health and to monitor the health of urban and rural residents. The six-level classification scheme is based on county or county equivalents. Large central metropolitan includes counties in a metropolitan statistical area (MSA) of 1 million or more population that contain the entire population of the largest principal city of the MSA, or whose entire population resides in the largest principal city of the MSA, or that contain at least 250,000 of the population of any principal city in the MSA. Large fringe metropolitan includes counties in an MSA of 1 million or more population that do not qualify as large central metropolitan. Medium metropolitan includes counties in an MSA of 250,000–999,999 population. Small metropolitan includes counties in an MSA of 50,000–249,999 population. A rural or nonmetropolitan area includes all counties that are outside of MSAs (8).
Data source and methods
All estimates are from the 2008 and 2009 National Hospital Ambulatory Medical Care Survey (NHAMCS), an annual nationally representative survey of visits to nonfederal, general, and short-stay hospital emergency and OPDs. The sampling frame for both the 2008 and 2009 NHAMCS were constructed from SDI's "Healthcare Market Index, Updated July 15, 2006" and "Hospital Market Profiling Solution, Second Quarter, 2006." The OPD visit response rate was 75% in 2008 and 73% in 2009. More details about NHAMCS methodology are available (9,10). OPD data in this study were limited to visits seen by a physician, PA, or APN (n = 59,165), of which 52,718 were seen by a physician (including 3,016 seen by both physician and PA or APN) and 6,447 were seen only by PAs or APNs. An estimated 10% of visits in 2008–2009 did not involve a physician, PA, or APN (n = 8,294) and were attended by an RN or licensed practical nurse, mental health provider, or some other provider. These visits were excluded from this report because they differed in character from physician, PA, and APN visits. In this report, missing information (weighted) for the following characteristics were not shown: hospital size (0.1%), teaching hospital status (0.2%), major reason for visit (1.3%), whether clinic was a patient's primary care provider (8.9%), and type of provider seen (1.1%).Data analyses were performed using the statistical packages SAS version 9.2 (SAS Institute, Cary, N.C.) and SUDAAN version 9.0 (Research Triangle Institute, Research Triangle Park, N.C.). Differences by type of provider and selected patient and visit characteristics were examined using t tests for differences in percentages and chi-square tests for differences in percent distributions at the p = 0.05 level. A weighted least-squares regression analysis was used to determine the significance of trends by year, hospital size, and location.
About the authors
Esther Hing and Sayeedha Uddin are with CDC's NCHS, Division of Health Care Statistics.References
- Cunningham R. Tapping the potential of the health care workforce: Scope-of-practice and payment policies for advanced practice nurses and physician assistants. National Health Policy Forum, Background Paper No. 76. The George Washington University: Washington, DC. 2010.
- Paradise J, Dark C, Bitler N. Improving access to adult primary care in Medicaid: Exploring the potential role of nurse practitioners and physician assistants. Kaiser Commission on Medicaid and the Uninsured, Issue Paper. The Henry J. Kaiser Family Foundation: Washington, DC. 2011.
- U.S. Department of Health and Human Services, Health Resources and Services Administration. The registered nurse population: Findings from the 2008 National Sample Survey of Registered Nurses. 2010.
- NCHS. National Hospital Ambulatory Medical Care Survey: 2008 outpatient department summary tables.
- NCHS. National Hospital Ambulatory Medical Care Survey: 2009 outpatient department summary tables. In preparation.
- Larson EH, Palazzo L, Berkowitz B, Pirani M, Hart G. The contribution of nurse practitioners and physician assistants to generalist care in Washington state. Health Serv Res 38(4):1033–50. 2003.
- McCaig LF, Hooker RS, Sekscenski ES, Woodwell DA. Physician assistants and nurse practitioners in hospital outpatient departments, 1993–1994. Public Health Rep 113(1):75–82. 1998.
- National Center for Health Statistics. 2006 NCHS urban-rural classification scheme for counties.
- National Center for Health Statistics. National Hospital Ambulatory Medical Care Survey. Public-use data file documentation. 2008.
- National Center for Health Statistics. National Hospital Ambulatory Medical Care Survey. Public-use data file documentation. 2009.
Suggested citation
Hing E, Uddin S. Physician assistant and advance practice nurse care in hospital outpatient departments: United States, 2008–2009. NCHS data brief, no 77. Hyattsville, MD: National Center for Health Statistics. 2011.Copyright information
All material appearing in this report is in the public domain and may be reproduced or copied without permission; citation as to source, however, is appreciated.National Center for Health Statistics
Edward J. Sondik, Ph.D., DirectorJennifer H. Madans, Ph.D., Associate Director for Science
Division of Health Care Statistics
Clarice Brown, M.S., Acting Directorfull-text (large):
Products - Data Briefs - Number 77 - November 2011


.png)

.png)


No hay comentarios:
Publicar un comentario