CMS BLOG
February 5, 2016
By Niall Brennan
Open Enrollment Trends: Selected HealthCare.gov Statistics prior to the Final Enrollment Deadline
Data as of February 1, 2016
Open Enrollment ended on January 31 with about 12.7 million Americans having selected plans through Health Insurance Marketplaces, including 3.1 million signed up through State-based Marketplaces and over 9.6 million through the HealthCare.gov platform. This does not include about 400,000 people who signed up on the New York and Minnesota Marketplaces for coverage through the Basic Health Program during this Open Enrollment.
Here’s a look at the progress HealthCare.gov states made during Open Enrollment for 2016 coverage:
The Marketplace continues to grow with more than 9.6 million plan selections for 2016. Over 9.6 million people signed up for health coverage through HealthCare.gov. This includes about 4 million new consumers, which means about 42 percent of those who signed up for coverage through HealthCare.gov for 2016 are new to the Marketplace.
New consumers joined the Marketplace earlier this year. Instead of waiting until the last moment, about 2.4 million or 60 percent of our new consumers signed up for coverage that started on January 1, 2016. Compare that with last year when 1.9 million or 40 percent of new consumers signed up for January 1, 2015 coverage. That means 30 percent more new consumers had coverage that started on January 1 this year compared to last year.
Returning Marketplace consumers are more engaged. Of the 5.6 million returning consumers in OE3, 3.9 million or about 70 percent were active returners. This means that a majority of 2015 consumers returning to the Marketplace actively selected a 2016 plan – either their same plan or a new plan – that met their needs. About 1.7 million or 30 percent of returning consumers were automatically re-enrolled into the same or a similar plan for 2016. At the end of OE2, there were 4.1 million returning consumers of which 2.2 million, or 53 percent, actively selected a plan and 2 million who were automatically re-enrolled.
Chart 1: Marketplace Consumers are More Engaged

*Data compares February 1, 2016 plan selection data with data from February 22, 2015.
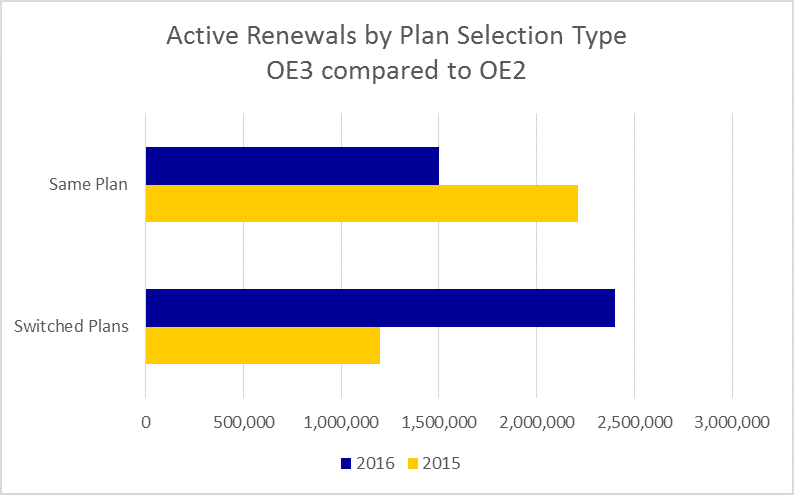
The majority of consumers who actively renewed their coverage switched plans. Of the 3.9 million active returners during OE3, 61 percent or 2.4 million switched plans. Last year during OE2, of the 2.2 million active returners, 54 percent or 1.2 million switched plans.
Chart 2: Consumers Who Actively Renewed Switched Coverage

*Data compares February 1, 2016 plan selection data with data from February 22, 2015.
More 18-34 year olds join the Marketplace. This year, 2.7 million consumers between the ages of 18-34 selected plans through HealthCare.gov compared to 2.5 million during OE2. In addition, 33 percent of new consumers were 18–34, compared to 31 percent in OE2. The overall percentage of those plan selections for those consumers between the ages of 18-34 remained stable.
Nearly all states have more plan selections at the end of OE3 than in OE2: Of the 37 states using the HealthCare.gov platform in both 2015 and 2016, 34 states have more plan selections at the end of OE3 than they had at the close of OE2. Those states with the largest rates of increases in plan selections between OE3 and OE2 are Oregon (31%), Utah (25%), Iowa (22%), South Dakota (22%) and Nevada (20%). The two states that make up a notably smaller share of plan selections this year than last year, Indiana and Pennsylvania, expanded Medicaid at the beginning of 2015. In these states, consumers with incomes between 100 and 138 percent FPL used to be eligible for Marketplace coverage, but now are eligible for Medicaid instead. Since February 2015, people enrolled in Medicaid has increased by 214,000 in Indiana and 247,000 in Pennsylvania.
Chart 3: Plan Selections in 2016 as a Share of 2015 Plan Selections by State

*Data compares February 1, 2016 plan selection data with data from February 22, 2015.
Plan selections in the top twenty media markets grew by 15 percent or more: Looking at larger local media markets (defined as having more than 25,000 plan selections), Portland, Oregon had the biggest percentage increase in plan selections between 2015 and 2016, with 24,000 more consumers selecting plans, a 34 percent increase. Salt Lake City also saw a surge in sign-ups, with 35,000 more consumers selecting plans for a growth rate of 25 percent.
Chart 4: Ratio of New Consumer Plan Selections in 2016 to all 2015 Plan Selections in 20 Large Cities

*Top 20 DMAs with over 25,000 plan selections in 2016. Data compares February 1, 2016 plan selection data with data from February 22, 2015.


.jpg)


No hay comentarios:
Publicar un comentario