NCHS Data Brief
Number 86, February 2012
Trends in Adults Receiving a Recommendation for Exercise or Other Physical Activity From a Physician or Other Health Professional
On This Page
- Key findings
- Are adults being advised by their physician to exercise?
- Are younger or older adults more likely to be advised by their physician to exercise?
- Are trends in receiving a physician's recommendation to exercise similar across all race/ethnicity groups?
- Does receiving advice to exercise vary with having selected chronic health conditions?
- Does receiving a physician's advice to exercise vary by body mass index (BMI)?
- Summary
- Definitions
- Data source and methods
- About the authors
- References
- Suggested citation
 (848 KB)
Patricia M. Barnes, M.A., and Charlotte A. Schoenborn, M.P.H.
Key findings
Data from the National Health Interview Survey, 2000, 2005, and 2010- In 2010, about one in three adults (32.4%) who had seen a physician or other health professional in the past 12 months had been advised to begin or continue to do exercise or physical activity.
- Between 2000 and 2010, the percentage of adults receiving advice to exercise increased by about 10 percentage points.
- Among adults aged 85 and over, the percentage receiving advice to exercise nearly doubled between 2000 (15.3%) and 2010 (28.9%).
- Receiving advice to exercise increased for adults with hypertension, cardiovascular disease, cancer, and diabetes.
- Adults who were overweight or obese had the largest percentage point increases over the decade 2000–2010 in being advised to exercise.
Keywords: doctor's advice, prevention, National Health Interview Survey
Are adults being advised by their physician to exercise?
- In 2010, about one in three adults who had seen a physician or other health professional in the past year had been advised to begin or continue to do exercise or physical activity (Figure 1).
- The percentage of adults who had been advised to exercise increased from 22.6% in 2000 to 32.4% in 2010.
- At each time point, women were more likely than men to have been advised to exercise.
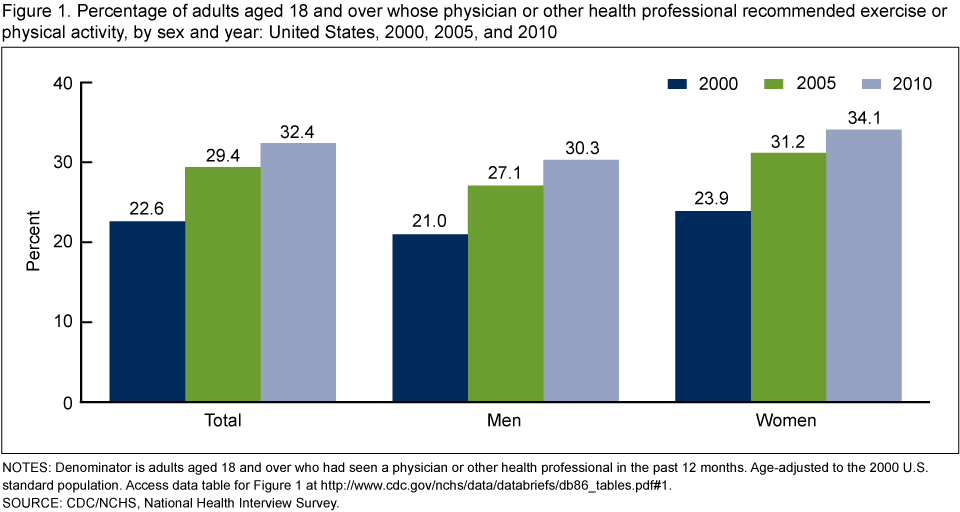
NOTES: Denominator is adults aged 18 and over who had seen a physician or other health professional in the past 12 months. Age-adjusted to the 2000 U.S. standard population. Access data table for Figure 1
[PDF - 158 KB].SOURCE: CDC/NCHS, National Health Interview Survey.
Are younger or older adults more likely to be advised by their physician to exercise?
- The percentage of adults who had been advised by their physician to exercise increased with age from the youngest (18–24 years) through the middle (45–64 years) and upper middle (65–74 years) age groups and then declined (Figure 2).
- Adults aged 18–24 had the smallest increase over the decade 2000–2010 in the percentage receiving a recommendation to exercise (from 10.4% in 2000 to 16.1% in 2010), while adults aged 85 and over had the largest percentage point increase (from 15.3% in 2000 to 28.9% in 2010).

NOTE: Denominator is adults aged 18 and over who had seen a physician or other health professional in the past 12 months.
Access data table for Figure 2
[PDF - 158 KB].SOURCE: CDC/NCHS, National Health Interview Survey.
Are trends in receiving a physician's recommendation to exercise similar across all race/ethnicity groups?
- Among adults who had seen a physician or other health professional in the past year, the percentage receiving advice to begin or continue to do exercise or physical activity increased among all race/ethnicity groups (Figure 3).
- Hispanic adults had the largest percentage point increase over the decade 2000–2010 in receiving a recommendation to exercise.

NOTES: Denominator is adults aged 18 and over who had seen a physician or other health professional in the past 12 months. Age-adjusted to the 2000 U.S. standard population. Access data table for Figure 3
[PDF - 158 KB].SOURCE: CDC/NCHS, National Health Interview Survey.
Does receiving advice to exercise vary with having selected chronic health conditions?
- Between 2000 and 2010, receipt of advice from a physician to do exercise or physical activity increased for adults with hypertension, cardiovascular disease, cancer, and diabetes (Figure 4).
- Adults with diabetes were more likely than those with hypertension, cardiovascular disease, or cancer to have been advised to exercise.
- In 2010, more than one-half of adults with diabetes were advised to exercise, compared with just over one-third of adults with cancer.

NOTES: Denominator is adults aged 18 and over who had seen a physician or other health professional in the past 12 months. Age-adjusted to the 2000 U.S. standard population. Access data table for Figure 4
[PDF - 158 KB].SOURCE: CDC/NCHS, National Health Interview Survey.
Does receiving a physician's advice to exercise vary by body mass index (BMI)?
- Adults who were obese were about twice as likely as healthy weight adults to have been advised by a physician or other health professional to do exercise or physical activity (Figure 5).
- The percentage of adults who had been advised to exercise increased in each BMI category between 2000 and 2010, although the percentage point increase was largest for adults who were obese (BMI 30.0 or above).
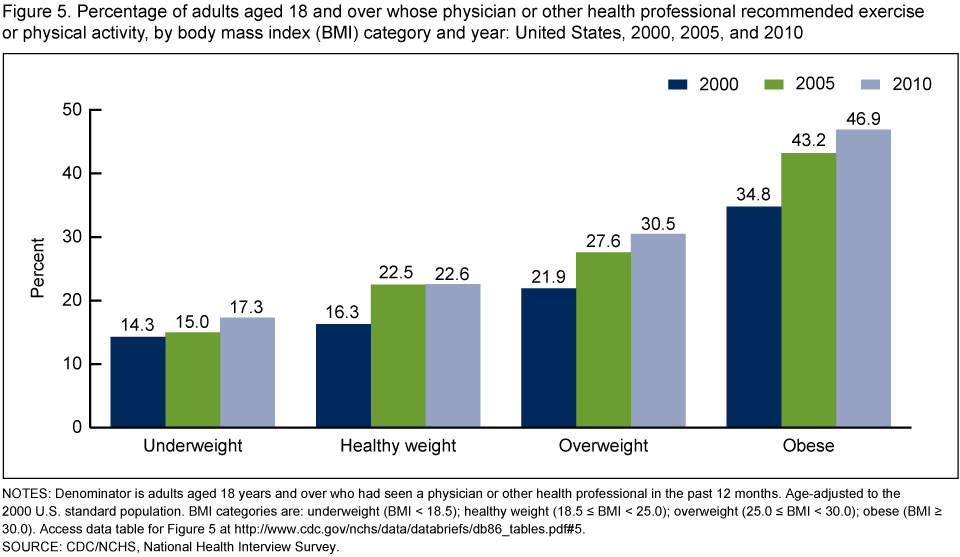
NOTES: Denominator is adults aged 18 years and over who had seen a physician or other health professional in the past 12 months. Age-adjusted to the 2000 U.S. standard population. BMI categories are: underweight (BMI < 18.5); healthy weight (18.5 ≤ BMI < 25.0); overweight (25.0 ≤ BMI < 30.0); obese (BMI ≥ 30.0). Access data table for Figure 5
[PDF - 158 KB].SOURCE: CDC/NCHS, National Health Interview Survey.
Summary
The Healthy People 2020 objectives for physical activity include two objectives for increasing the proportion of physician office visits that include counseling or education related to exercise (visit the Healthy People websiteIn 2010, about one in three adults (32.4%) who had seen a physician or other health professional in the past year had been advised to exercise or do other physical activity, which reflects an upward trend since 2000, moving in the direction of meeting Healthy People 2020 goals. In relative terms, there has been more than a 40% increase—from 22.6% of adults in 2000 to 32.4% in 2010.
Although increases were noted for every population and health condition group studied, these increases were larger for some groups than others. The increase in the percentage of adults receiving exercise advice is particularly noteworthy for the oldest age group. In 2000, 15.3% of adults aged 85 and over had been advised to exercise; by 2010, the percentage had increased to 28.9%. Across the chronic health conditions studied, adults with diabetes were the most likely, and those with cancer were the least likely, to have been advised by their physician to exercise. An upward trend of 8–10 percentage points, however, was seen among adults with each of the chronic diseases examined. Adults who were overweight or obese saw among the largest increases over the decade in the percentage receiving a physician's advice to exercise. The percentage of healthy weight adults receiving exercise advice also increased over the decade, but to a lesser extent.
Trends over the past 10 years suggest that the medical community is increasing its efforts to recommend participation in exercise and other physical activity that research has shown to be associated with substantial health benefits. Still, the prevalence of receiving this advice remains well below one-half of U.S. adults and varies substantially across population subgroups.
Definitions
Body mass index: Based on respondent-reported height and weight and calculated using the formula BMI = weight (kilograms)/height (meters)2. Categories of BMI are: underweight (BMI less than 18.5); healthy weight (18.5 to less than 25.0); overweight (25.0 to less than 30.0); and obese (30.0 or more).Chronic health condition: The chronic health conditions studied were hypertension; coronary heart disease, angina, myocardial infarction, or any other kind of heart disease or condition (combined under "cardiovascular disease"); cancer; and diabetes. Adults were classified as having the condition based on separate questions asking if they had ever been told by a physician or other health professional that they had the condition. Respondents could report multiple conditions. Hypertension is defined as having been told they had high blood pressure two or more times.
Physician or other health professional: "Physician" refers to medical doctors (MDs) and osteopathic physicians (DOs), including general practitioners and all types of specialists (e.g., internists, gynecologists, obstetricians, psychiatrists, and ophthalmologists). "Other health professional" includes physician assistants, psychologists, nurses, physical therapists, and chiropractors. In this report, the term "physician" used alone refers to a physician or other health professional.
Exercise advice or recommendation: Based on the question "During the past 12 months, did a doctor or other health professional recommend that you begin or continue to do any type of exercise or physical activity?" The question was asked of adults who had seen a physician or other health professional in the past 12 months, which is the denominator for all percentages shown in this report. When used alone, the term "exercise" refers to exercise or physical activity.
Data source and methods
National Health Interview Survey (NHIS) data are collected continuously throughout the year for the Centers for Disease Control and Prevention's (CDC) National Center for Health Statistics (NCHS) by interviewers from the U.S. Census Bureau. NHIS is a household-based survey collecting information about the health and health care of the U.S. population. Interviews are generally conducted in respondents' homes, although some interviews may be completed over the telephone. The survey consists of (a) a family component, with questions asked of all members of the family; (b) a sample adult component, which collects additional information from one adult per family; and (c) a sample child component, which collects additional information about one child per family. In addition, special topic supplements collect information on topics of current public health interest in some years. The estimates presented in this report are based on an identical question asked of persons aged 18 and over in the NHIS adult cancer supplements in 2000, 2005, and 2010, cosponsored by the National Cancer Institute and CDC in each of these years. (See "Definitions" for question wording.) The unweighted numbers of adults who had seen a physician or other health professional in the past 12 months for each of these years were: 26,402 (2000); 25,607 (2005); and 21,850 (2010). For further information about NHIS, including questionnaire content, visit the NHIS website.NHIS is designed to yield a sample representative of the civilian noninstitutionalized population of the United States, and the present analysis used weights to produce national estimates. Data weighting procedures are described in detail elsewhere (13). Point estimates and estimates of corresponding variances for this analysis were calculated using SUDAAN software (14) to account for the complex sample design of NHIS. The Taylor series linearization method was used for variance estimation. All estimates shown in this report meet NCHS standards of reliability (relative standard error less than or equal to 30%). Differences between percentages were evaluated using two-sided significance tests at the 0.05 level. Terms such as "greater than" and "less than" indicate statistically significant differences. Terms such as "similar" and "no difference" indicate that the statistics being compared were not significantly different. Lack of comment regarding the difference between any two statistics does not necessarily suggest that the difference was tested and found to be not significant. Statistics shown in Figures 1, 3, 4, and 5 are age-adjusted to the 2000 U.S. standard population using four age groups: 18–24, 25–44, 45–64, and 65 and over.
About the authors
The authors are with CDC's National Center for Health Statistics. Patricia Barnes is with the Office of Research and Methodology; Charlotte Schoenborn is with the Division of Health Interview Statistics.References
- Kruk J. Physical activity in the prevention of the most frequent chronic diseases: An analysis of the recent evidence. Asian Pac J Cancer Prev 8(3):325–38. 2007.
- Brown WJ, Burton NW, Rowan PJ. Updating the evidence on physical activity and health in women. Am J Prev Med 33(5):404–11. 2007.
- Martinsen EW. Physical activity in the prevention and treatment of anxiety and depression. Nord J Psychiatry 62(suppl 47):25–9. 2008.
- Aoyagi Y, Shephard RJ. Steps per day: The road to senior health? Sports Med 39(6):423–38. 2009.
- Paterson DH, Jones GR, Rice CL. Ageing and physical activity: Evidence to develop exercise recommendations for older adults. Can J Public Health 98(suppl 2):S69–108. 2007.
- McDermott AY, Mernitz H. Exercise and older patients: Prescribing guidelines. Am Fam Physician 74(3):437–44. 2006.
- Patrick K, Pratt M, Sallis RE. The healthcare sector's role in the U.S. national physical activity plan. J Phys Act Health 6(suppl 2):S211–9. 2009.
- Weidinger KA, Lovegreen SL, Elliott MB, Hagood L, Haire-Joshu D, Mcgill JB, Brownson RC. How to make exercise counseling more effective: Lessons from rural America. J Fam Pract 57(6):394–402. 2008.
- Frank E, Tong E, Lobelo F, Carrera J, Duperly J. Physical activity levels and counseling practices of U.S. medical students. Med Sci Sports Exerc 40(3):413–21. 2008.
- Pleis JR, Benson V, Schiller JS. Summary health statistics for U.S. adults: National Health Interview Survey, 2000
- Pleis JR, Lethbridge-Çejku M. Summary health statistics for U.S. adults: National Health Interview Survey, 2005
- Schiller JS, Lucas JW, Ward BW, Peregoy JA. Summary health statistics for U.S. adults: National Health Interview Survey, 2010
- Botman SL, Moore TF, Moriarity CL, Parsons VL. Design and estimation for the National Health Interview Survey, 1995–2004
- SUDAAN, release 9.1 [computer software]. Research Triangle Park, NC: RTI International. 2004.
Suggested citation
Barnes PM, Schoenborn CA. Trends in adults receiving a recommendation for exercise or other physical activity from a physician or other health professional. NCHS data brief, no 86. Hyattsville, MD: National Center for Health Statistics. 2012.Copyright information
All material appearing in this report is in the public domain and may be reproduced or copied without permission; citation as to source, however, is appreciated.National Center for Health Statistics
Edward J. Sondik, Ph.D., DirectorJennifer H. Madans, Ph.D., Associate Director for Science
Office of Research and Methodology
Nathaniel Schenker, Ph.D., Associate Director
Division of Health Interview Statistics
Jane F. Gentleman, Ph.D., Director
Products - Data Briefs - Number 86 - February 2012


.png)

.png)


No hay comentarios:
Publicar un comentario