NCHS Health E-Stat
Recent Trends in Births and Fertility Rates Through June 2011
by Brady E. Hamilton, Ph.D., and Paul D. Sutton, Ph.D., Division of Vital StatisticsOn this Page
 (81 KB)
The provisional count of births in the United States for the 12-month period ending June 2011 was 3,978,000, which was 2 percent lower than the provisional count of 4,057,000 for the 12-month period ending June 2010 (Figure) (1). This continues the decline in the number of births from the all-time high of 4,316,233 in 2007 (2); the rate of decline appears to have slowed from January 2011 to June 2011 (1).
The provisional fertility rate in the United States for the 12-month period ending June 2011 declined as well, down 2 percent to 64.4 births per 1,000 women aged 15–44 from 65.5 for the 12-month period ending June 2010 (Figure) (1). This continues the decline in the fertility rate from the 17-year high of 69.5 in 2007 (2), but again, the rate of decline appears to have slowed in the first 6 months of 2011 (1).
Data sources and methods
Provisional counts and rates are based on 12 months of provisional data ending with the specified month. Provisional counts are rounded to the nearest thousand. For further information about provisional data, see Births, Marriages, Divorces, and Deaths: Provisional Data for 2009 (3). Data for 2005–2009 in the Figure are final (2). Rates for 2005 through June 2011 shown in this report are based on 2000 (postcensal) population estimates. Rates for 2005–2009 may differ from the revised rates published in Births: Preliminary Data for 2010 [PDF - 584 KB] (4),
which are based on (intercensal) population estimates based on the
2000 and 2010 censuses. Monthly (postcensal) population estimates based
on the 2010 census were not available as of the writing of this
report. Rates based on 2000 (postcensal) population estimates are
generally higher compared with rates based on (intercensal) population
estimates based on the 2000 and 2010 censuses (4).References
- National Center for Health Statistics. Provisional monthly and 12-month ending number of live births, deaths, and infant deaths and rates: United States, January 2010–June 2011. Internet table.
- Martin JA, Hamilton BE, Ventura SJ, et al. Births: Final data for 2009
- Tejada-Vera B, Sutton PD. Births, marriages, divorces, and deaths: Provisional data for 2009. National vital statistics reports; vol 58 no 25. Hyattsville, MD: National Center for Health Statistics. 2010.
- Hamilton BE, Martin JA, Ventura SJ. Births: Preliminary Data for 2010
Figure
Figure. Birth and fertility rates: United States, final 2005–2009 and provisional June 2010, December 2010, and June 2011
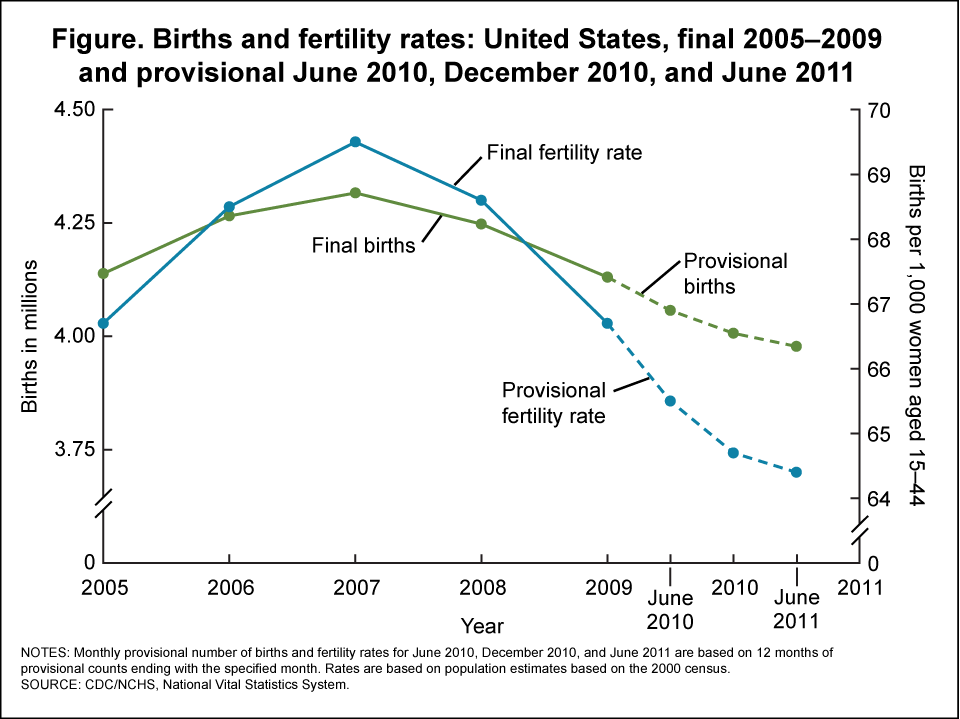
NOTES: Monthly provisional number of births and fertility rates for June 2010, December 2010, and June 2011 are based on 12 months of provisional counts ending with the specified month. Rates are based on population estimates based on the 2000 census.
SOURCE: CDC/NCHS, Nation Vital Statistics System.


.png)

.png)


No hay comentarios:
Publicar un comentario