

Evaluating Healthy Corner Stores: A Survey of Assessment Tools Used in the San Francisco Bay Area, 2016
RESEARCH BRIEF — Volume 14 — June 1, 2017
Benjamin Chrisinger, PhD1 (View author affiliations)
Suggested citation for this article: Chrisinger B. Evaluating Healthy Corner Stores: A Survey of Assessment Tools Used in the San Francisco Bay Area, 2016. Prev Chronic Dis 2017;14:170002. DOI: http://dx.doi.org/10.5888/pcd14.170002.
PEER REVIEWED
Abstract
Stakeholders from healthy corner store programs in the San Francisco Bay Area convened in November 2015 to discuss the future of programmatic and collaborative efforts. This study’s objective, to gather and synthesize the types of evaluation tools used in the 9-county region, was identified as one of several priorities. Tools were collected via an online survey in July 2016, and data were extracted for comparison, including data on the number and types of food items, nutritional standards, and store characteristics. Twenty-five evaluation tools were collected, and differences were found in nutritional standards, terminology, and use of validated measures. Discrepancies between evaluation tools should be reconciled to make robust regional comparisons.
Objective
Across the United States, programs have been implemented among corner store retailers to improve the availability of healthy food options, especially in low-income areas without access to larger food retailers (1). Although many initiatives are evaluated at the local level, various tools and methods are used, challenging efforts to consider regional effects or collaborations (2–5). Various corner store programs exist in the 9 San Francisco Bay Area counties (Alameda, Contra Costa, Marin, Napa, San Francisco, San Mateo, Santa Clara, Solano, and Sonoma). Our objective was to catalog and synthesize the types of information collected by evaluations of these programs.
Methods
In November 2015, a meeting of program managers of Bay Area healthy corner stores and other stakeholders agreed on the need to understand when, where, and how evaluations are conducted. As an exploratory step, an online survey was developed and sent to all 77 attendees in July 2016 to collect and classify the types of evaluations being used. Respondents were encouraged to upload all relevant evaluation tools with their completed online study survey. In addition to uploading the evaluation tool, each respondent was asked to provide information on when the tool was used, the scope of the tool, whether it was from a standardized source and externally validated or developed by the local stakeholder, kinds of information collected (eg, prices, availability), and method of data collection (eg, interview, paper/tablet-based audit). Responses and evaluation tools were accepted through August 2016.
Survey responses were collected and organized. Several types of data were extracted from the evaluation tools. These included data on food items and nutritional standards and store characteristics, such as the number of registers in the store and whether the store participated in federal food assistance programs. Evaluation tools were classified into 3 categories according to the method used: in-store observation or audit, consumer interview, and owner or manager interview. Evaluation tools were also coded by the number of items assessed in 7 food categories (dairy, protein, grain, fruit and vegetable, snack, beverage, and other food), nonfood goods or services sold, and store characteristics. All categories were divided into subcategories; for example, dairy was subcategorized by milk (eg, 1%, skim, whole, flavored/unflavored), milk alternatives (eg, soy beverages, almond milk), and other dairy items (eg, yogurt, cheese) (Box). Descriptive statistics were generated for type of method used, category, and subcategory. Results were also presented to a group of healthy food retail stakeholders in the San Francisco area for additional refining in December 2016.
Results
Twenty-five unique evaluation tools were reported via online survey (n = 14) or email to the author (n = 11). Of these, 5 were excluded because they did not provide sufficient information to extract summary data for comparison. Only 1 evaluation tool was externally validated (4), whereas others were created or compiled by local researchers or managers. Among types of methods, in-store observations or audits were most prevalent (n = 11), followed by consumer interviews (n = 5), and owner/manager interviews (n = 4). On average, by type of method used, in-store observations or audits had 25.7 items (standard deviation [SD], 14.4), consumer interviews had 24.6 items (SD, 13.3), and owner/manager interviews had 12.5 items (SD, 13.3).
Evaluation tools collected information on an average of 22.8 items (SD, 14.2), with fruits and vegetables, beverage, and store characteristic categories having the highest average number of items (Figure 1). Of the 20 evaluation tools, 18 included beverage items and/or fruits and vegetables and 16 included some type of assessment of store characteristics.
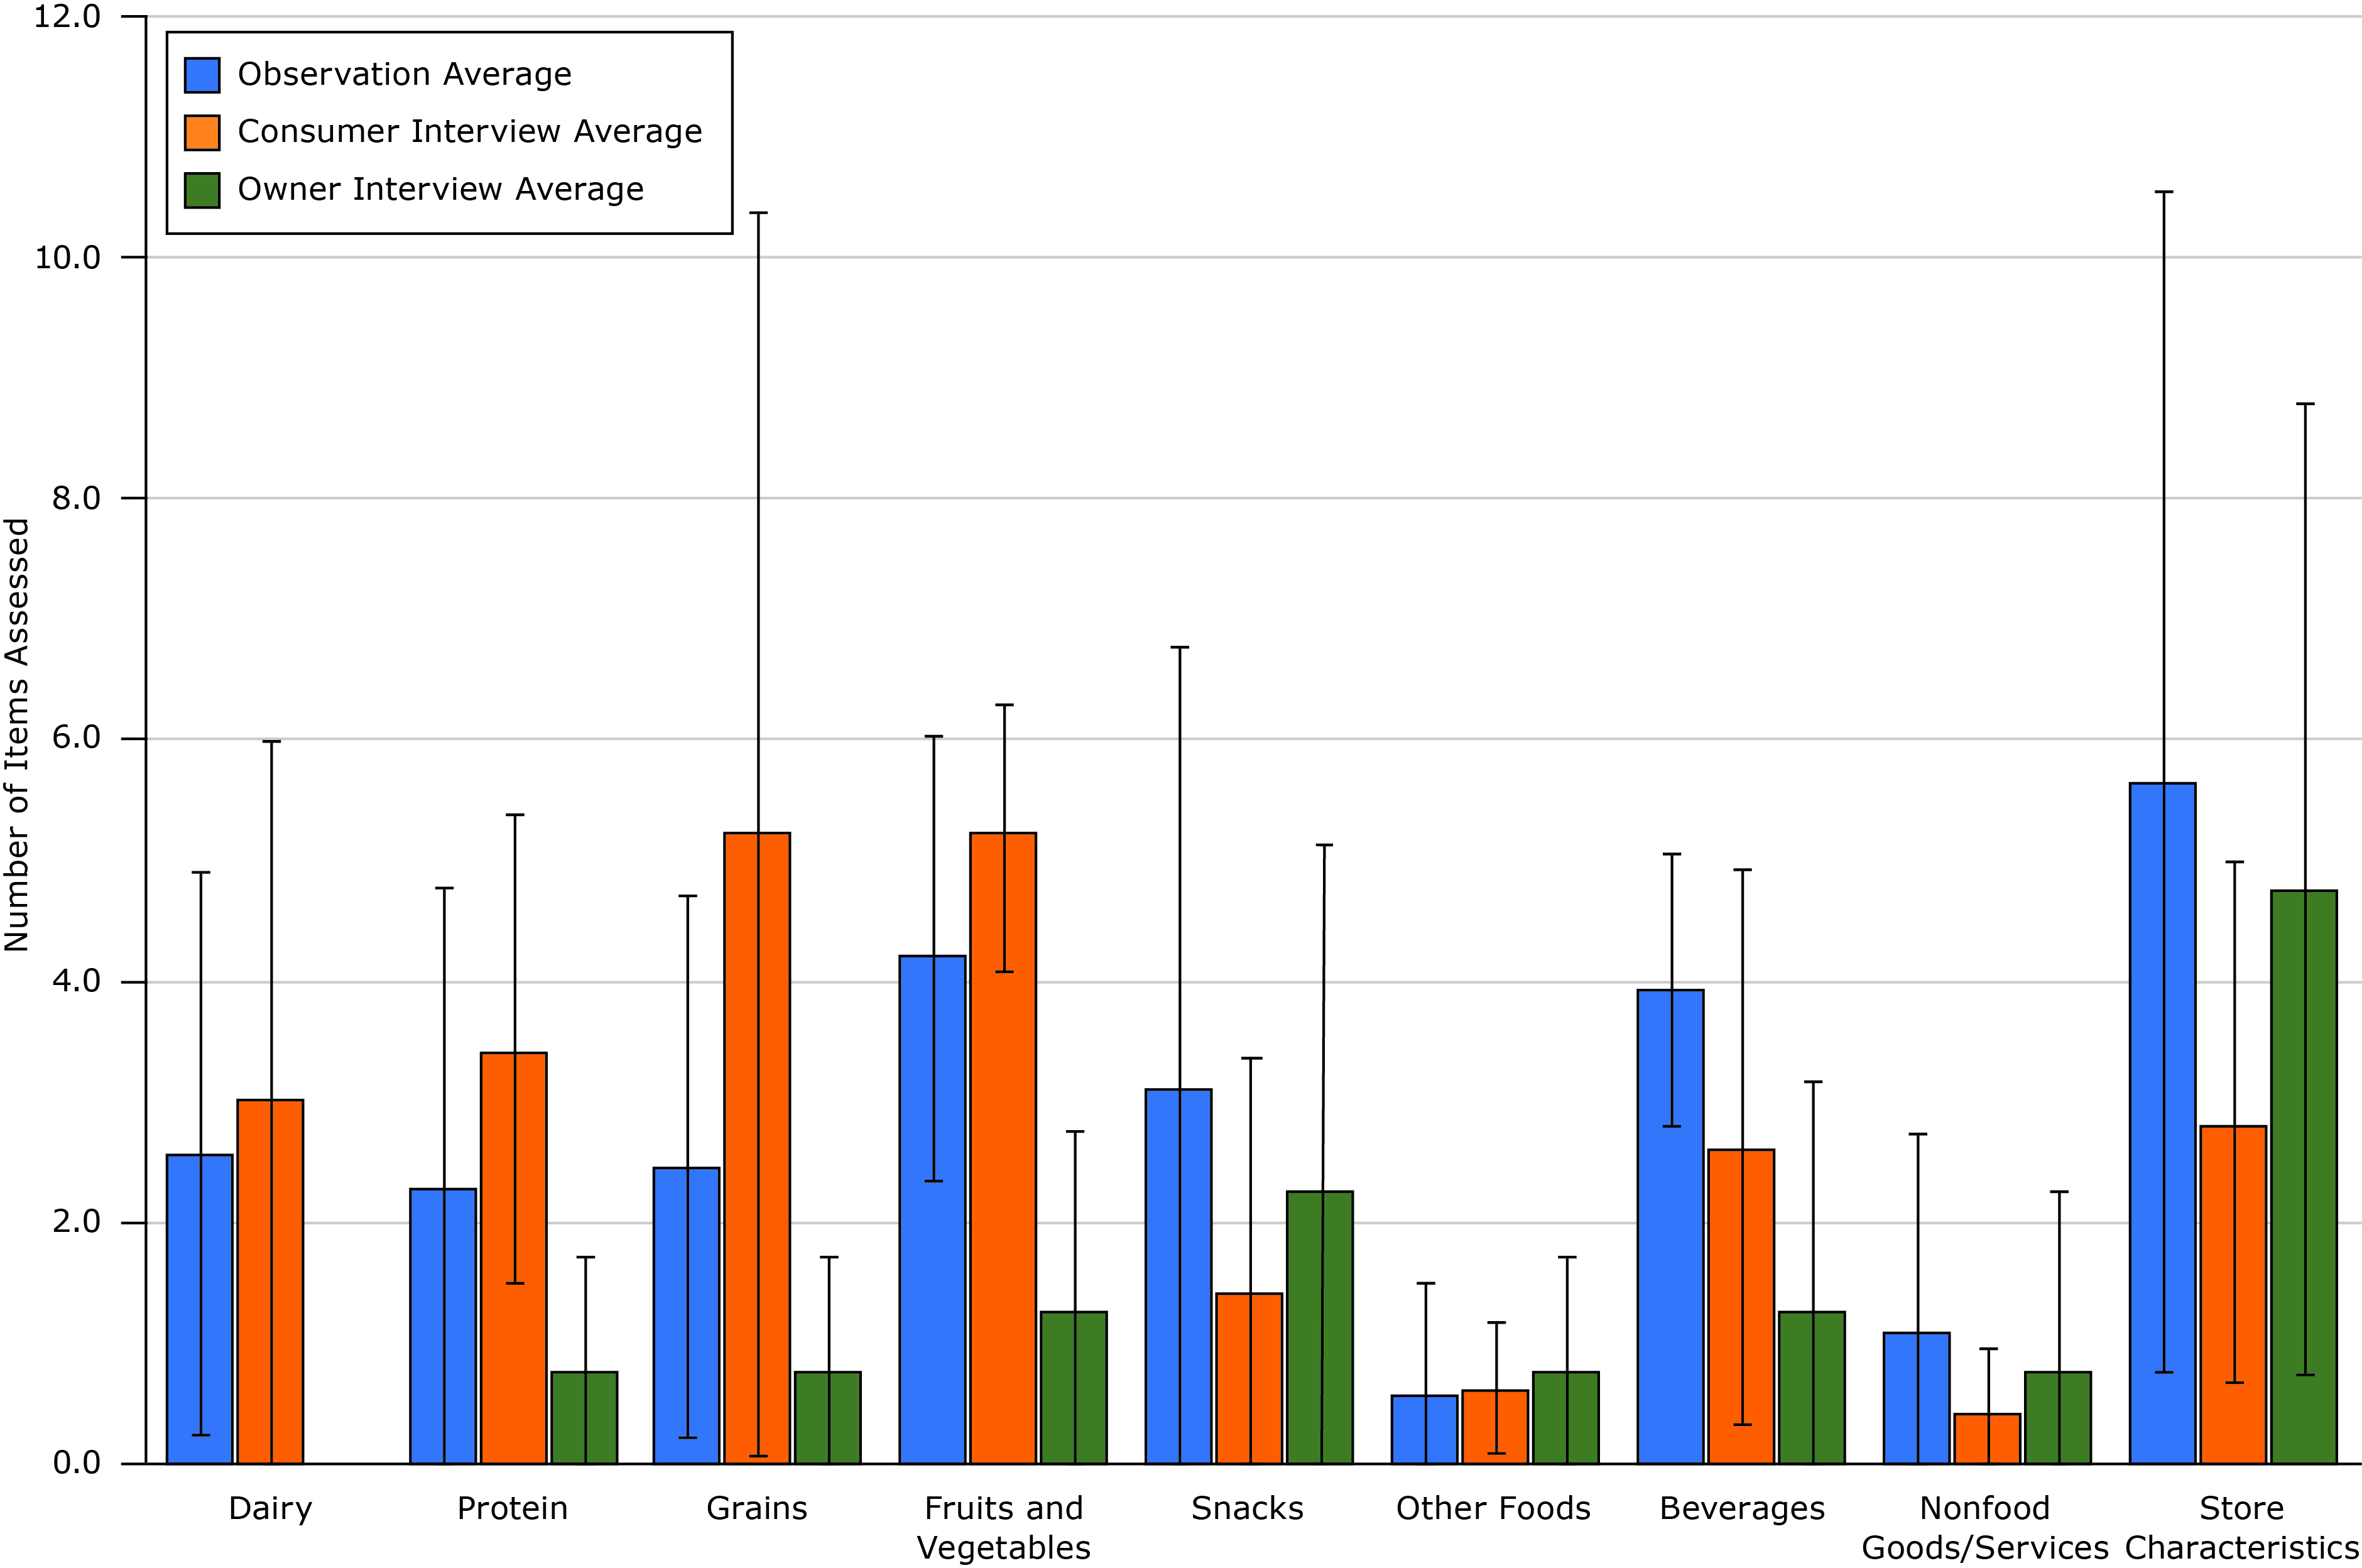
Figure 1. Average number of items assessed in evaluations of healthy corner stores, by type of method used, San Francisco Bay Area, 2016. None of the owner interviews assessed dairy, so no bar appears for that item. Error bars indicate standard deviation. [A tabular version of the figure is also available.]
Nutritional language or standards varied by subcategory of food ( Table). For example, one tool applied standards for sugar content in yogurt (≤13 g sugar for children’s yogurt, ≤20 g sugar for others), while others only recorded its presence or absence. Disagreement between nutrition claims was not widespread, though exceptions existed; for example, grain and snack food categories included multiple definitions of allowable sugar content. When presented to the stakeholder group, many of these findings appeared to be consistent with practitioner observations and generated questions for future research.
Discussion
Study results clarify the role of various evaluation tools for various purposes: establishing objective baseline conditions, documenting changes, and ensuring compliance with program goals (observational tools); understanding individual and community-level perceptions and attitudes about foods and retailers and gathering insights about neighborhood needs (customer interviews); and characterizing the uptake and sustainability of in-store interventions (owner interviews). Validated observational measures were reported by 3 counties (eg, the California Department of Public Health’s CX3 tool (4)), and standardized, nonvalidated instruments were used by 5 counties (eg, Center for Science in the Public Interest’s healthy checkout audit [6]). This study’s findings suggest that greater standardization and documentation of rigorous methods could be useful but would entail additional costs (eg, staff time, training).
To compare results and assess impact at a regional level, disagreements within item categories and between evaluation classes must be addressed. Across the 3 types of evaluation tools, the number of items varied most (SD >3.0) for store characteristics, grains, and snacks. Regional stakeholders have already initiated an effort to codify nutritional standards with a focus on snacks. This study provides additional motivation for similar work and identifies other possible priority areas for standardization.
This study has several limitations. Although efforts were made to reach all area stakeholders, some evaluation tools may have been excluded. Generalizability may also be limited to areas where political or logistical realities are amenable to similar stakeholder engagement.
To understand and compare standards in various methods of evaluating healthy corner stores in the 9-county Bay Area, it was necessary to take stock of existing evaluation tools. This study identified 3 general classes of evaluation tools and the categories and subcategories of items these tools recorded. This information may be useful in future collaboration or pooling of data. Insights from this study provide additional motivation for coordination in establishing regional standards.
Acknowledgments
The author thanks the Bay Area Healthy Retail Committee for their participation and support of this exploratory research. This work was supported by National Institutes of Health/National Heart, Lung, and Blood Institute grant no. T32 HL007034.
Author Information
Benjamin Chrisinger, PhD, Stanford Prevention Research Center, Stanford University School of Medicine, 1070 Arastradero Rd, Suite 300, Palo Alto, CA 94304. Telephone: 650-497-8000. Email: chrisinger@stanford.edu.
Author Affiliations: 1Stanford Prevention Research Center, Stanford University School of Medicine, Palo Alto, California.
References
- Gittelsohn J, Rowan M, Gadhoke P. Interventions in small food stores to change the food environment, improve diet, and reduce risk of chronic disease. Prev Chronic Dis 2012;9:E59. PubMed
- Glanz K, Sallis JF, Saelens BE, Frank LD. Nutrition Environment Measures Survey in stores (NEMS-S): development and evaluation. Am J Prev Med 2007;32(4):282–9. CrossRef PubMed
- Pitts SBJ, Bringolf KR, Lawton KK, McGuirt JT, Wall-Bassett E, Morgan J, et al. Formative evaluation for a healthy corner store initiative in Pitt County, North Carolina: assessing the rural food environment, part 1. Prev Chronic Dis 2013;10:E121.
- Ghirardelli A, Quinn V, Sugerman S. Reliability of a retail food store survey and development of an accompanying retail scoring system to communicate survey findings and identify vendors for healthful food and marketing initiatives. J Nutr Educ Behav 2011;43(4, Suppl 2):S104–12. CrossRef PubMed
- Gittelsohn J, Laska MN, Karpyn A, Klingler K, Ayala GX. Lessons learned from small store programs to increase healthy food access. Am J Health Behav 2014;38(2):307–15. CrossRefPubMed
- Fielding-Singh P, Almy J, Wootan MG. Sugar overload: retail checkout promotes obesity. Washington (DC): Center for Science in the Public Interest; 2014. https://cspinet.org/sites/default/files/attachment/sugaroverload.pdf.


.png)


No hay comentarios:
Publicar un comentario