
Global Trends in the Affordability of Sugar-Sweetened Beverages, 1990–2016
ORIGINAL RESEARCH — Volume 14 — May 4, 2017
Evan Blecher, PhD1; Alex C. Liber, MSPH2; Jeffrey M. Drope, PhD2; Binh Nguyen, PhD3; Michal Stoklosa, MA2 (View author affiliations)
Suggested citation for this article: Blecher E, Liber AC, Drope JM, Nguyen B, Stoklosa M. Global Trends in the Affordability of Sugar-Sweetened Beverages, 1990–2016. Prev Chronic Dis 2017;14:160406. DOI: http://dx.doi.org/10.5888/pcd14.160406.
PEER REVIEWED
Abstract
Introduction
The objective of this study was to quantify changes in the affordability of sugar-sweetened beverages, a product implicated as a contributor to rising rates of obesity worldwide, as a function of product price and personal income.
Methods
We used international survey data in a retrospective analysis of 40 high-income and 42 low-income and middle-income countries from 1990 to 2016. Prices of sugar-sweetened beverages were from the Economist Intelligence Unit’s World Cost of Living Survey. Income and inflation data were from the International Monetary Fund’s World Economic Outlook Database. The measure of affordability was the average annual percentage change in the relative-income price of sugar-sweetened beverages, which is the annual rate of change in the proportion of per capita gross domestic product needed to purchase 100 L of Coca-Cola in each country in each year of the study.
Results
In 79 of 82 countries, the proportion of income needed to purchase sugar-sweetened beverages declined on average (using annual measures) during the study period. This pattern, described as an increase in the affordability of sugar-sweetened beverages, indicated that sugar-sweetened beverages became more affordable more rapidly in low-income and middle-income countries than in high-income countries, a fact largely attributable to the higher rate of income growth in those countries than to a decline in the real price of sugar-sweetened beverages.
Conclusion
Without deliberate policy action to raise prices, sugar-sweetened beverages are likely to become more affordable and more widely consumed around the world.
Introduction
In recent years the consumption of sugar-sweetened beverages has increased in both high-income countries (HICs) and low-income and middle-income countries (LMICs) (1–3). Because sugar-sweetened beverage consumption is linked to obesity and overweight — risk factors for many noncommunicable diseases, including cardiovascular diseases, many cancers, and type 2 diabetes — this trend has generated concern in the public health community (4–6). Obesity and overweight can be modifiable risk factors, and decreases in consumption of sugar-sweetened beverages tend to reduce their prevalence and therefore the prevalence of disease (7,8).
Overweight and obesity are reaching record-high levels. From 2000 to 2013, the global prevalence of overweight and obesity increased by one-quarter among adults and by nearly half among children; by 2013, more than 2 billion people were overweight, and of these, more than 674 million were obese (9). In 2010, overweight and obesity were estimated to cause 3.4 million deaths worldwide (10), a number that is likely to increase in line with rising overweight and obesity rates. The annual health care costs attributable to obesity and overweight are more than $600 billion (11).
As with the consumption of most other consumer products, consumption of sugar-sweetened beverage tends to rise when prices decline (12). Similarly, sugar-sweetened beverage consumption also tends to grow as consumer income grows (2,13). This increased consumption can negatively affect health (12) with potentially heightened effects in discrete groups such as young people or certain racial/ethnic groups (2,14,15). Scholars have examined the broader implications of tax and price increases on consumption of sugar-sweetened beverages, including implications for discrete groups such as lower-income households (13,16). An increasing number of experts, including a recent panel at the World Health Organization, overtly promote interventions that will affect price, most commonly excise taxation (17–19).
The strategies of the soft drink industry also likely influence sugar-sweetened beverage consumption. In particular, the industry undermines people’s ability to resist overconsuming sugar-sweetened beverages by lowering the unit price as product size increases (20). The industry also spends hundreds of millions every year globally to advertise sugar-sweetened beverages, especially to children and adolescents (21). Of the 2 largest sugar-sweetened beverage manufacturers, the Coca-Cola Company spent the 8th most and PepsiCo spent the 10th most among all corporations to advertise their products globally in 2013 (22). To facilitate these marketing strategies, Coca-Cola and many similar firms have created extensive and well-organized global distribution networks guaranteeing the ubiquity of their products (23).
To understand and predict consumers’ decisions on sugar-sweetened beverage purchases, many studies have focused on trends in food prices (24,25). Price alone, however, is an imperfect predictor of consumers’ purchasing behaviors. With many LMICs experiencing high rates of economic growth, it is necessary to focus on the effect of personal income on consumption as well. Addressing the shortcoming of research that has historically conceptualized price and income in isolation, recent public health research has begun to focus on affordability, which measures changes in prices and income simultaneously. Measures of affordability are typically expressed as the percentage of a worker’s income (26) or duration of work time required to buy a defined amount of product (27) or both (28,29).
The measurement of affordability of other products, such as cigarettes and alcohol — both major risk factors for noncommunicable disease — is common (29–31). Alcohol has become more affordable over time, and increases in affordability have been driven largely by increases in incomes (32). Research on cigarette affordability demonstrates divergent results between HICs and LMICs. Cigarettes are less affordable in HICs where there are concerted efforts to raise prices through increased excise taxes; however, they are more affordable in most LMICs where rapid increases in incomes outpace any increases in taxes and prices (30).
To date, no research has measured systematically the affordability of sugar-sweetened beverages or trends thereof, although some researchers have considered the concept of affordability of sugar-sweetened beverages or the relative prices of other foods and sugar-sweetened beverages, a related but less powerful conceptualization of affordability (1,12). On the other hand, the soft drink industry is already using the affordability concept, as Coca-Cola’s marketing strategy has explicitly identified increasing affordability of sugar-sweetened beverages as a key growth strategy (23).
We argue that affordability is an indispensable measure to understand and predict consumers’ decisions on sugar-sweetened beverage purchases. Affordability should definitively influence the trajectory of the global overweight and obesity epidemic because it takes into account the simultaneous effect of price and income on consumers’ purchasing behaviors. Our study applies existing techniques used mostly to evaluate the affordability of cigarettes and alcohol to measure the affordability of sugar-sweetened beverages. We compared the most recent estimates of affordability (in 2016) among countries, trends in affordability from 1990 through 2016, and the decomposition of price and income effects on changes in affordability.
Methods
The main reason to examine both changes in prices and affordability is that the magnitude of the changes in prices and affordability is most likely to affect behavior over time. Accordingly, we measured trends by using the average annual percentage change, which was estimated by using the constant growth regression technique (33). To consider changes in prices over time, nominal prices were converted to real prices to take into account inflation (in constant 2010 prices). We used the relative-income price method to measure the affordability of sugar-sweetened beverages. This method was developed to measure trends in affordability of cigarettes (29). The method uses a broad measure of income (per capita gross domestic product [GDP]), which is appropriate for research on LMICs because it is a comprehensive measure of economic activity, for example, by including crucial components of the economy such as the value of public goods and services as well as transfer payments. Although not perfect (for example, in some HICs, some evidence suggests that wages and/or household incomes are not keeping up with overall growth for some discrete groups [34,35]), this method also permits the calculation of affordability for the largest group of countries and the longest possible annual time series. Narrower measures of income, such as wages, are not as widely and frequently available as GDP and thus would limit the number of countries, particularly the number of LMICs, and the length and frequency of the time series (30). Narrow measures of income may be preferable for individual country studies or for groups of countries where such data are readily available.
The relative-income price for cigarettes measures the percentage of per capita GDP needed to purchase 100 packs of cigarettes per year. We adapted this measure to estimate the percentage of per capita GDP to purchase 100 L of sugar-sweetened beverages. A higher relative-income price means that sugar-sweetened beverages are less affordable than in a country or time period with a lower relative-income price, and an increase in relative-income price means that sugar-sweetened beverages have become less affordable. The relative-income price is a relative concept and has no absolute meaning; that is, a sugar-sweetened beverage cannot be affordable or unaffordable, but rather can be more or less affordable than in another country or time period.
We used Coca-Cola as a proxy for all sugar-sweetened beverages because it is the most globally recognizable sugar-sweetened beverage brand and largely homogeneous. The greater availability of data for this product also permits us to include many more countries and a longer time series. Coca-Cola is the largest carbonated soft drink brand in the world, comprising 25.8% of the global market in 2014, more than double its closest competitor. Including Coca-Cola derivatives (eg, Diet Coke), the brand accounts for 32.8% of the global market for carbonated soft drinks (36). Furthermore, some research suggests that despite complexity in pricing among sugar-sweetened beverage firms, prices for like-products commonly converge (37).
Price data were drawn from the Economist Intelligence Unit’s World Cost of Living Survey (38). This survey annually collects prices on many consumer goods. Sugar-sweetened beverages are represented by the price of 1 L of Coca-Cola in 2 retail environments (a supermarket and a mid-priced store). By convention, we used the lowest price of the two (in some countries and/or years only one environment is surveyed) (29,30). The survey collects prices by city. In many countries only a single city is surveyed, and we used data for that city. However, in some countries, multiples cities are surveyed, and we used the average price. When cities were added at a later stage or during inconsistent time periods, by convention, we did not include the additional cities (29,30).
Income data were collected from the International Monetary Fund’s World Economic Outlook Database (39) in the local currency to calculate the relative-income price. During periods of hyperinflation, US dollar values were used instead. Real prices for those countries were estimated in US dollars as well. Countries were categorized as either an HIC or an LMIC according to the World Bank’s most recent classification. The sample consisted of 82 countries: 42 LMICs and 40 HICs.
The analysis was conducted in 3 parts. We first considered the differences among countries in 2016 for prices in US dollars and the relative-income price. Second, we considered the trends in real prices and the relative-income price from 1990 through 2016. Third, because changes in affordability can be driven by declines in prices or increases in incomes or a combination of the two, it is useful to decompose the change in affordability into the changes in prices and incomes. To illustrate this, we subtracted the average annual percentage change of price from the average annual percentage change of relative-income price, thereby estimating the average annual percentage change of income and then stacking the price and income components. Because an increase in price increases the relative-income price but an increase in income decreases the relative-income price, we inverted the income series so that the stacked components combined to measure the change in affordability. We then ordered the series by the change in affordability.
Results
Price and affordability
The mean (standard deviation) price of 1 L of Coca-Cola in 2016 was $0.73 ($0.26) among all countries surveyed ( Table 1); the price varied considerably around the world, ranging from $0.38 per liter in Ukraine to $2.74 per liter in Papua New Guinea (Figure 1). Both the lowest and highest prices were in LMICs. The mean and median prices for sugar-sweetened beverages were higher in HICs than in LMICs, although the differences were not large (Table 1). We found substantial variation in both the LMIC and HIC groups, although the within-group variation was similar.
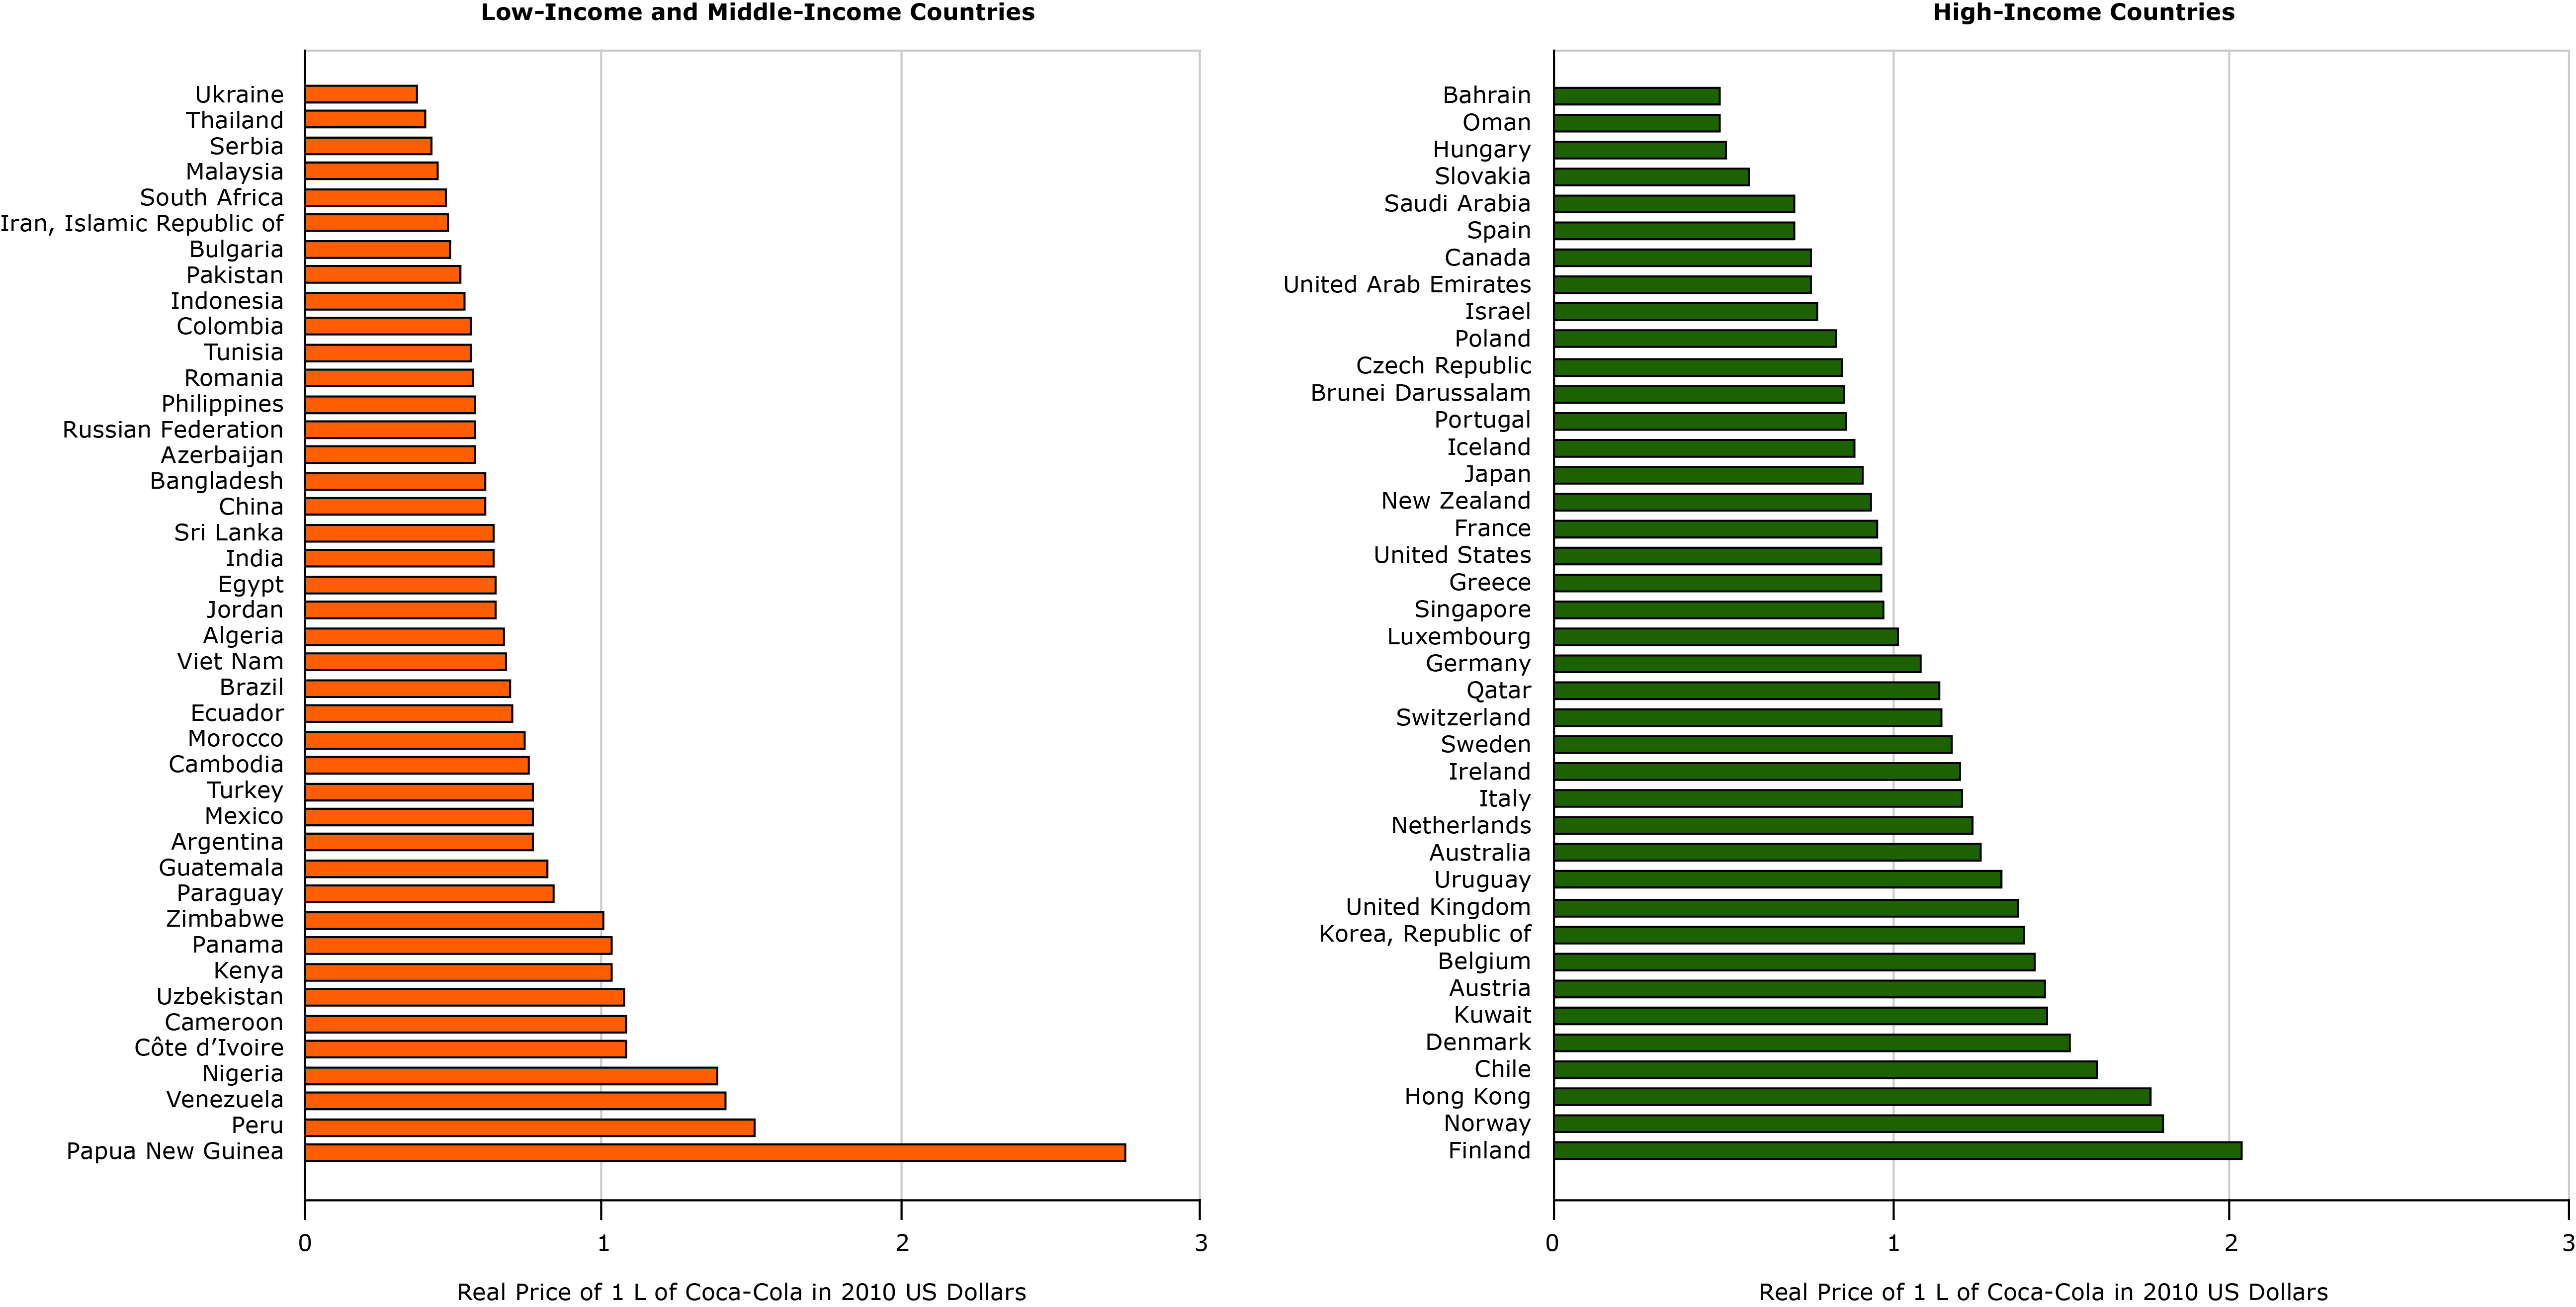
Figure 1. Real price of 1 L of Coca-Cola in 40 high-income and 42 low-income and middle-income countries, in 2010 US dollars, 2016. [A text version of this figure is also available.]
We found a different result in the affordability of sugar-sweetened beverages (Figure 2). The relative-income price of sugar-sweetened beverages varied, ranging from 0.11% of annual per capita GDP to purchase 100 L in Luxembourg to 11.24% in Zimbabwe. The lowest relative-income prices were found in HICs and the highest relative-income prices were found in LMICs. Sugar-sweetened beverages were substantially more affordable in almost all HICs than in LMICs.
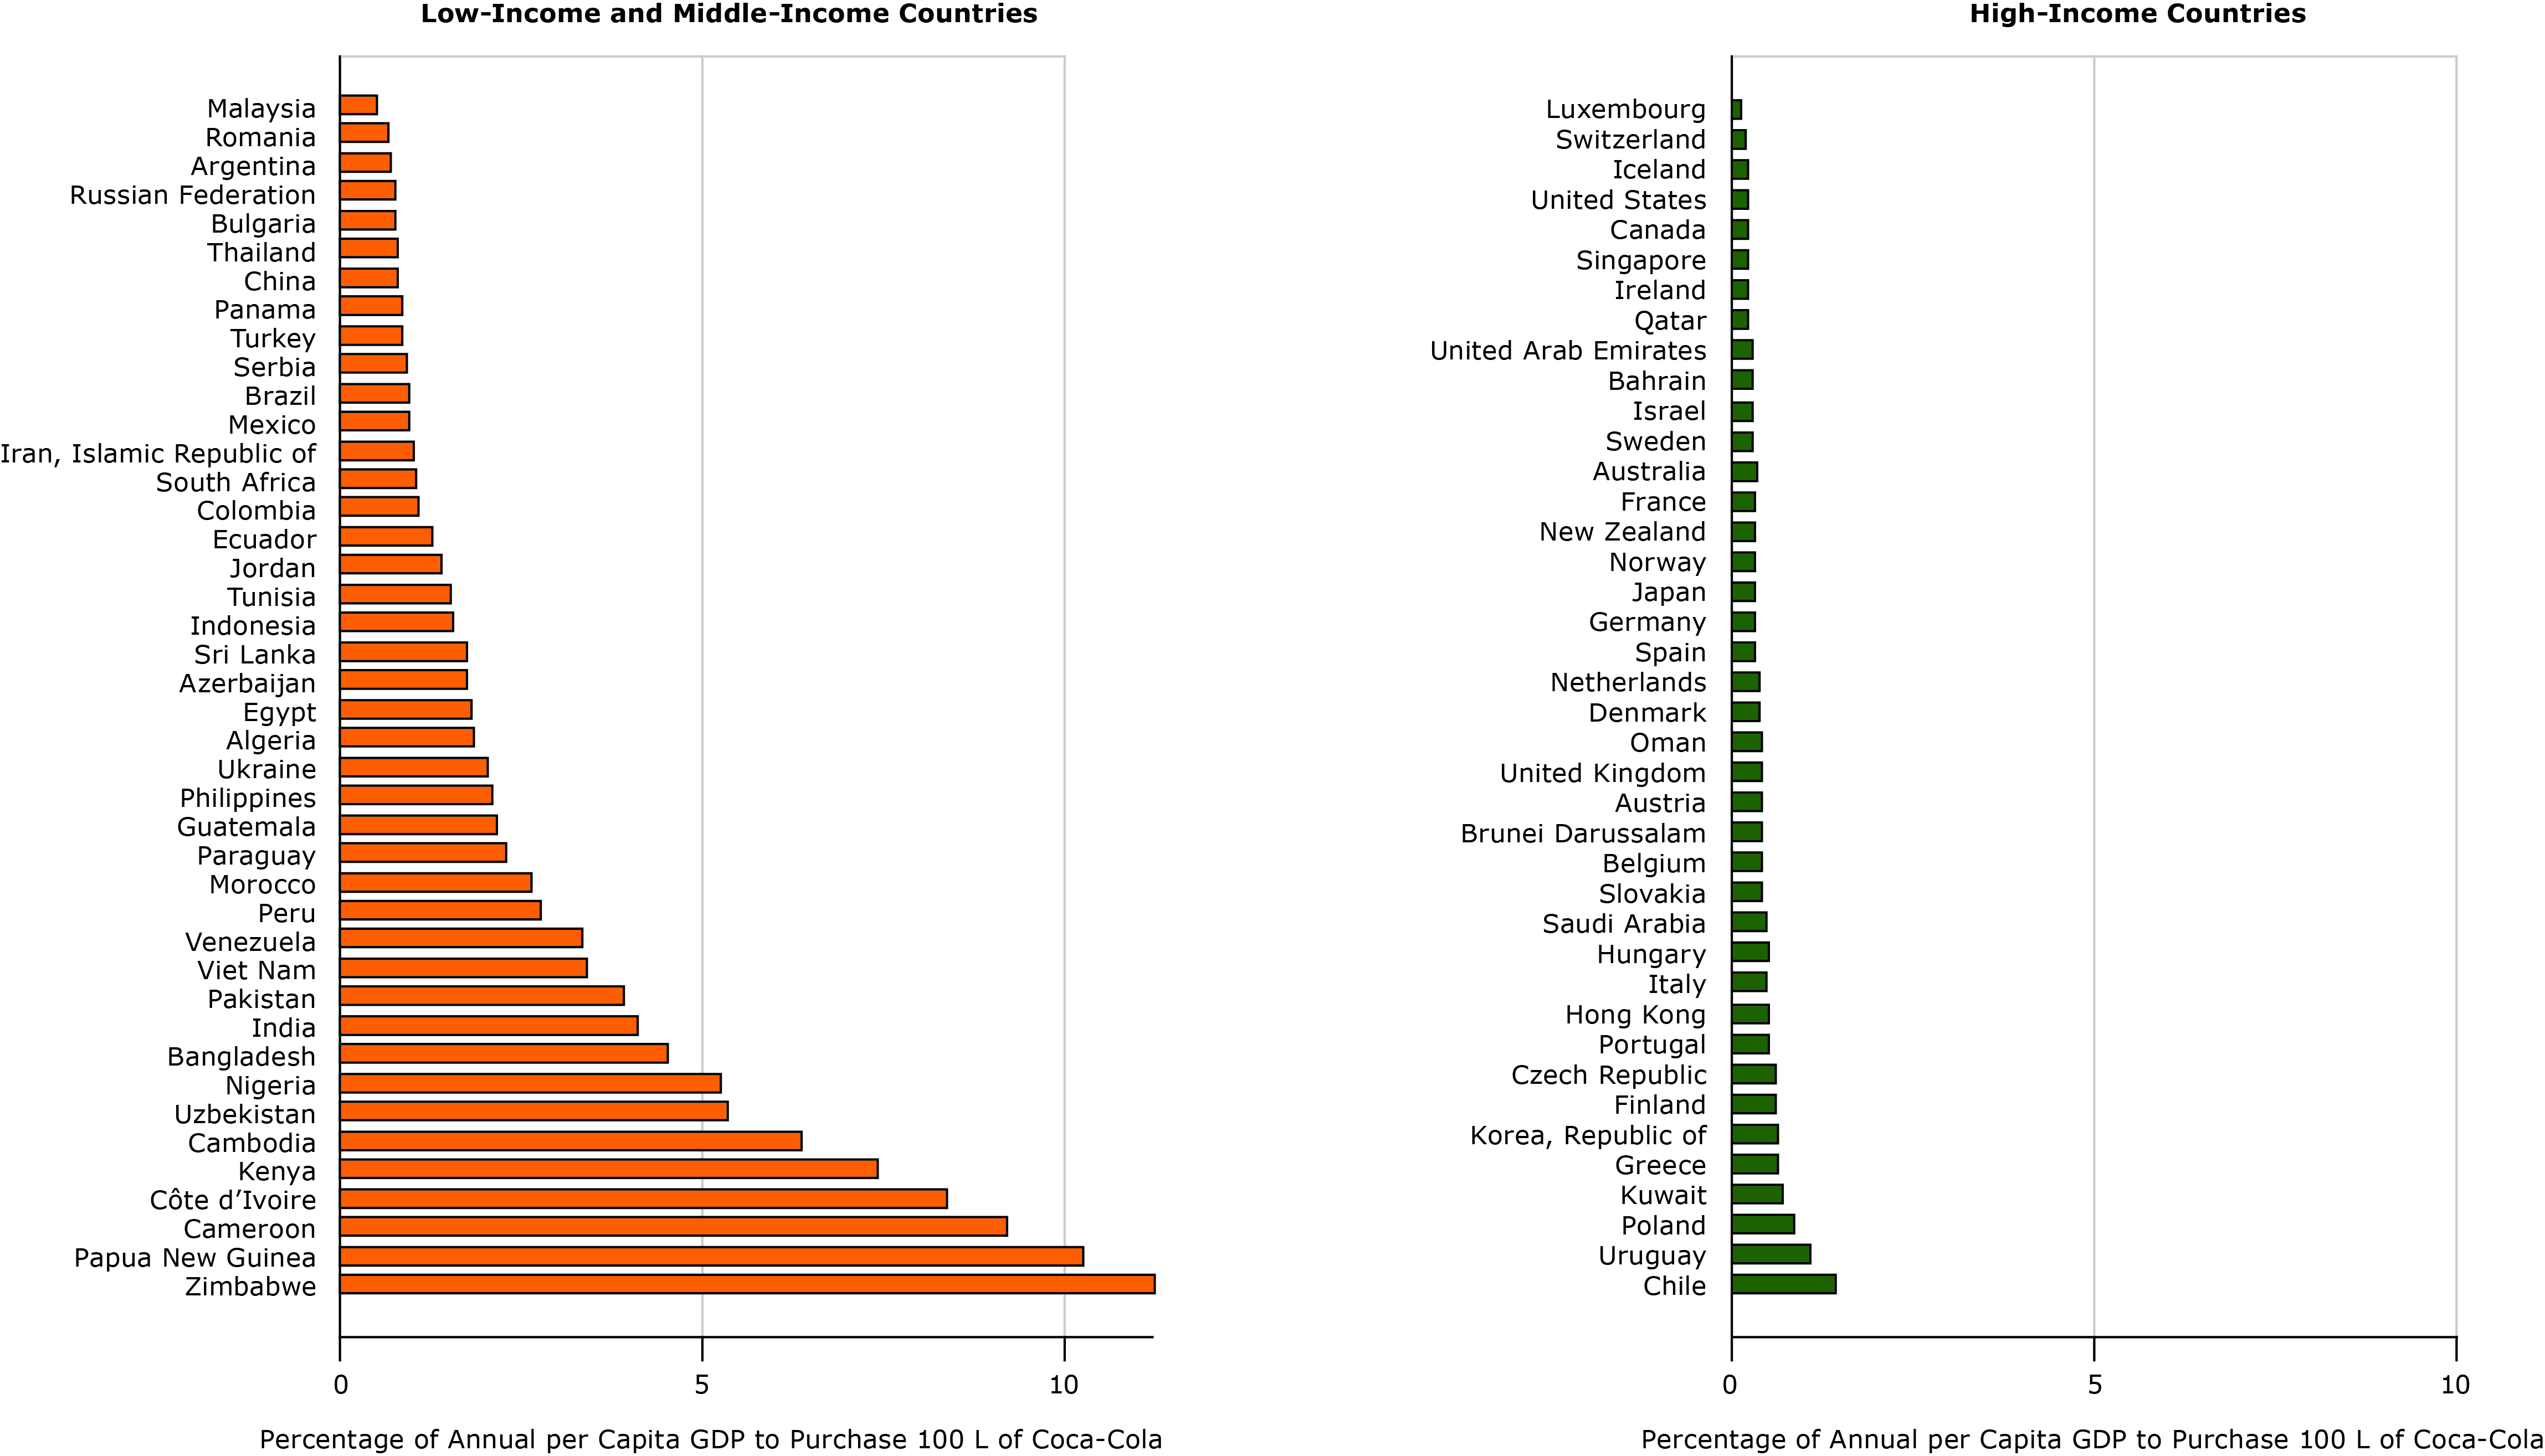
Figure 2. Relative-income price of 100 L of Coca-Cola in 40 high-income and 42 low-income and middle-income countries, 2016. Units are percentage of annual per capita gross domestic product (GDP) to purchase 100 L of Coca-Cola. [A text version of this figure is also available.]
Changes in prices and affordability between 1990 and 2016
The real prices of sugar-sweetened beverages increased in 26 countries and declined in 56 countries on average annually between 1990 and 2016 (Figure 3). In HICs, the real price increased in 16 countries and decreased in 24 countries; in LMICs, real prices increased in 10 countries, and decreased in 32 countries. At the average and the median, real prices and relative-income prices of sugar-sweetened beverages declined in both LMICs and HICs ( Table 2); however, we found wide within-group variation.
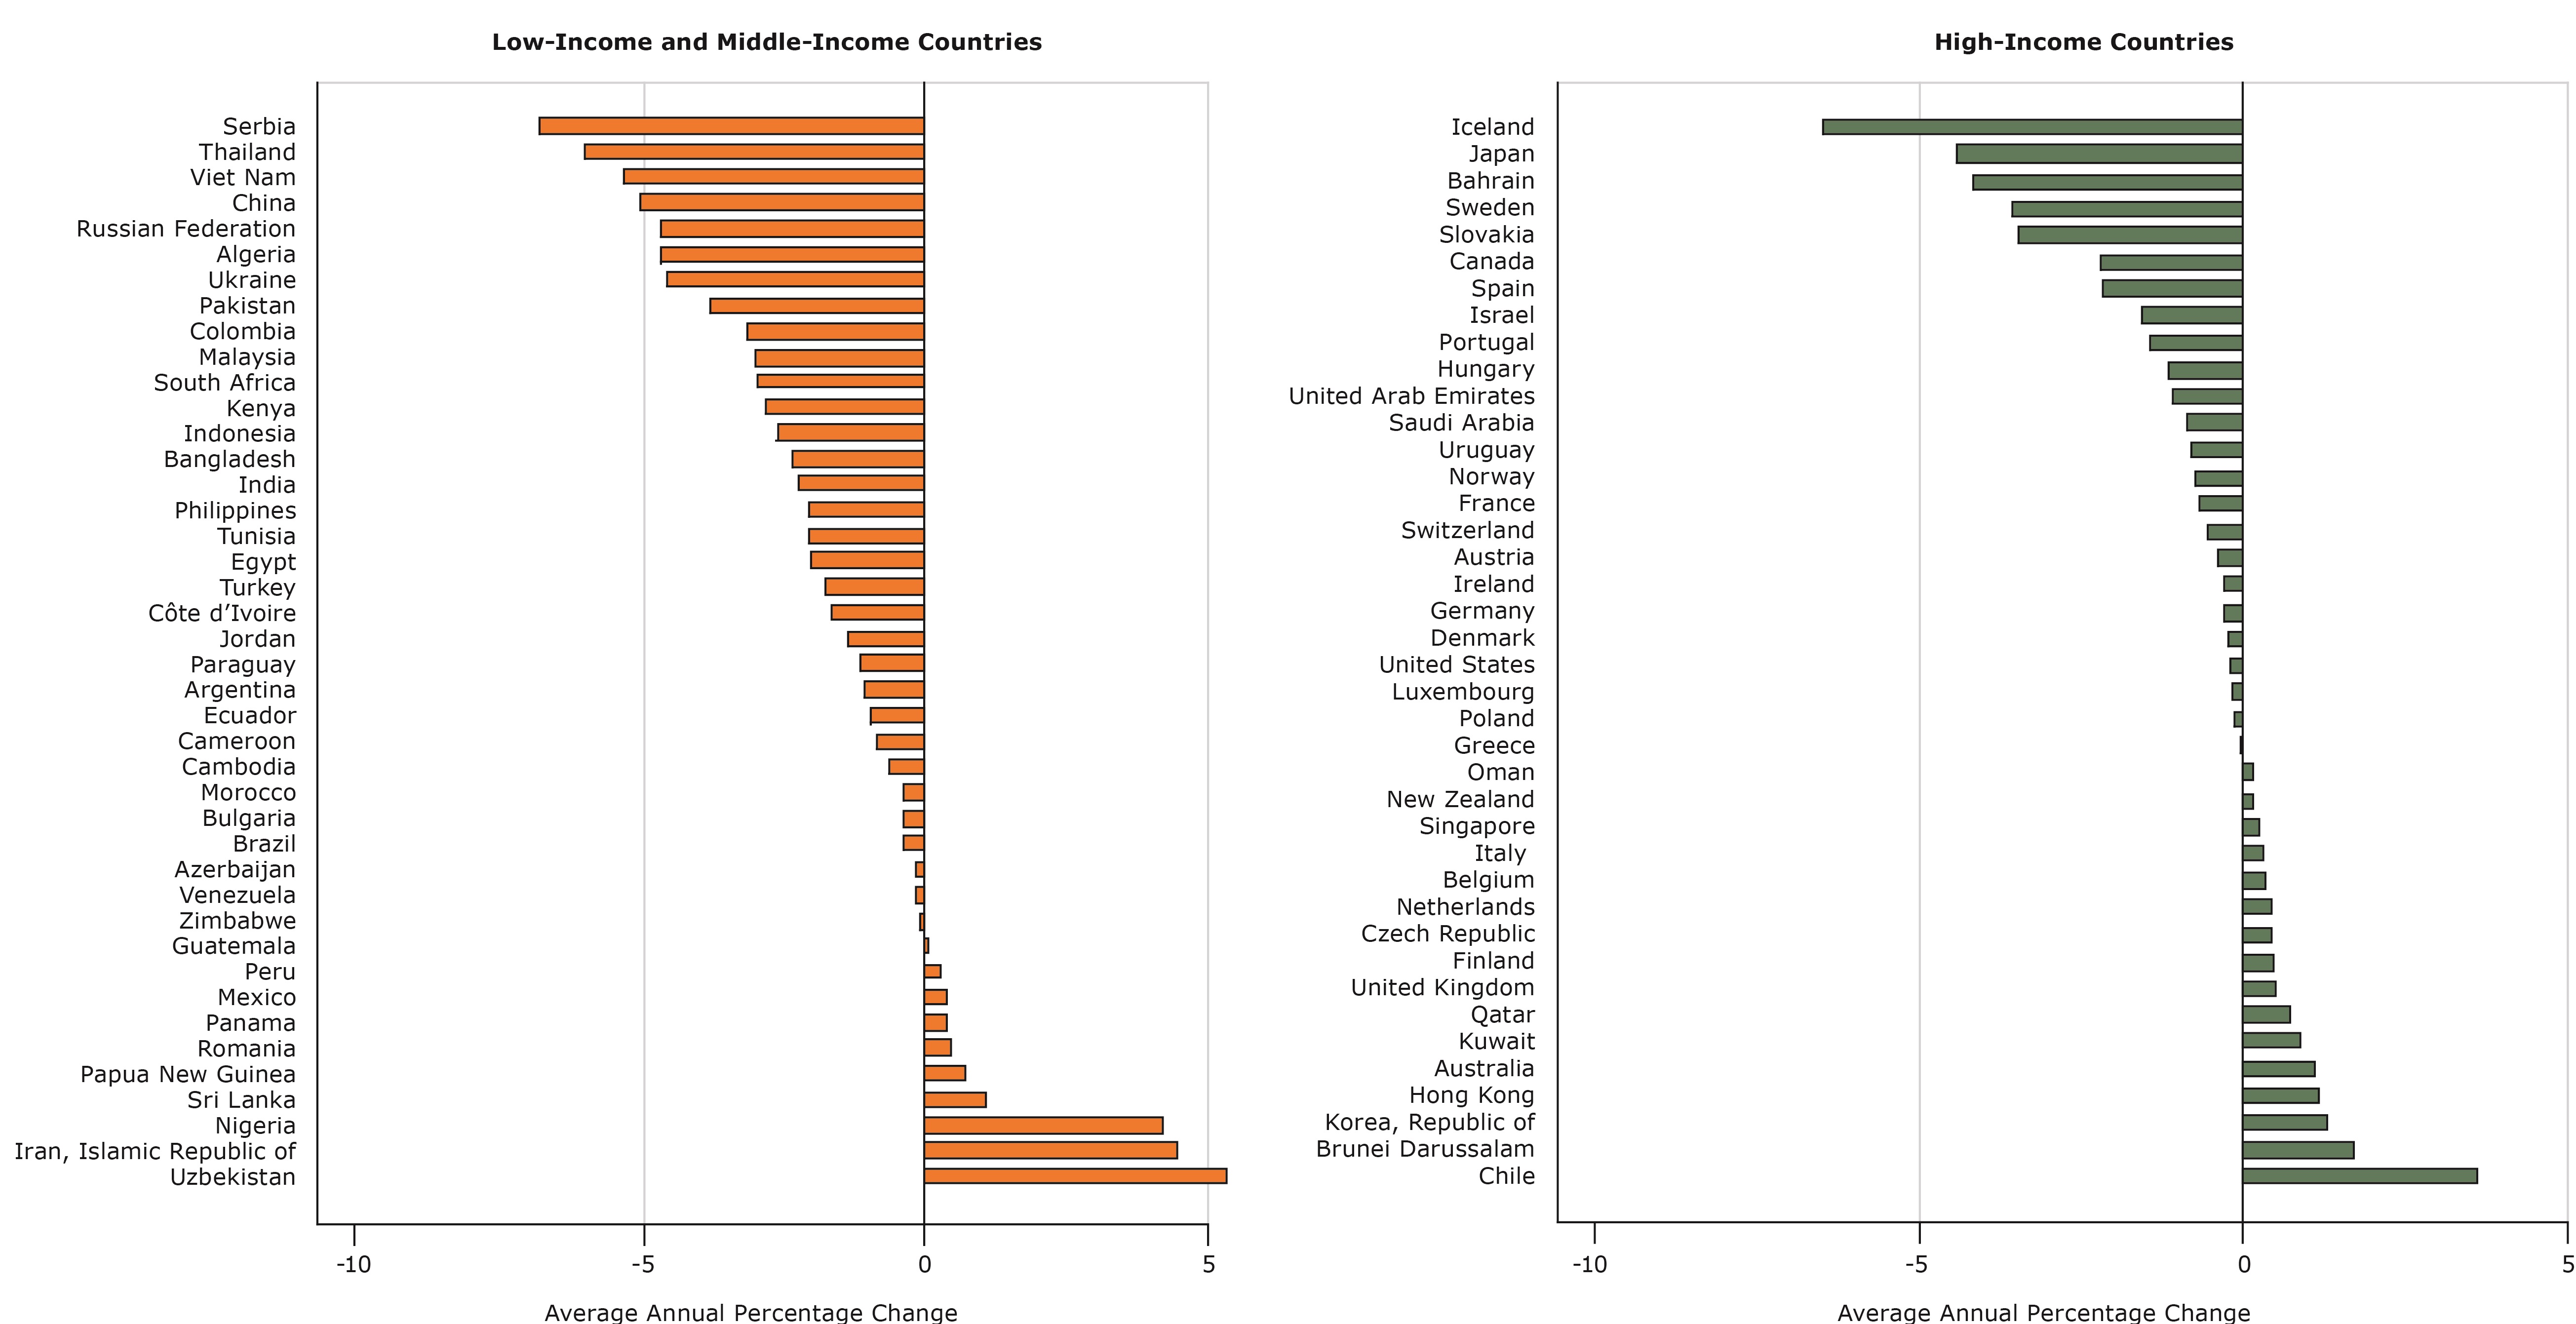
Figure 3. Average annual percentage change in real prices of sugar-sweetened beverages in 40 high-income and 42 low-income and middle-income countries from 1990 to 2016. [A text version of this figure is also available.]
Sugar-sweetened beverages became more affordable on average annually between 1990 and 2016 in most countries; they became less affordable in only 3 countries or territories (Hong Kong, Papua New Guinea, and Zimbabwe) (Figure 4). Although the average annual percentage change in affordability varied within groups (LMICs and HICs), sugar-sweetened beverages became more affordable more rapidly in LMICs (by an average of 8.76% per year) than in HICs (an average of 1.96% per year) (Table 2).
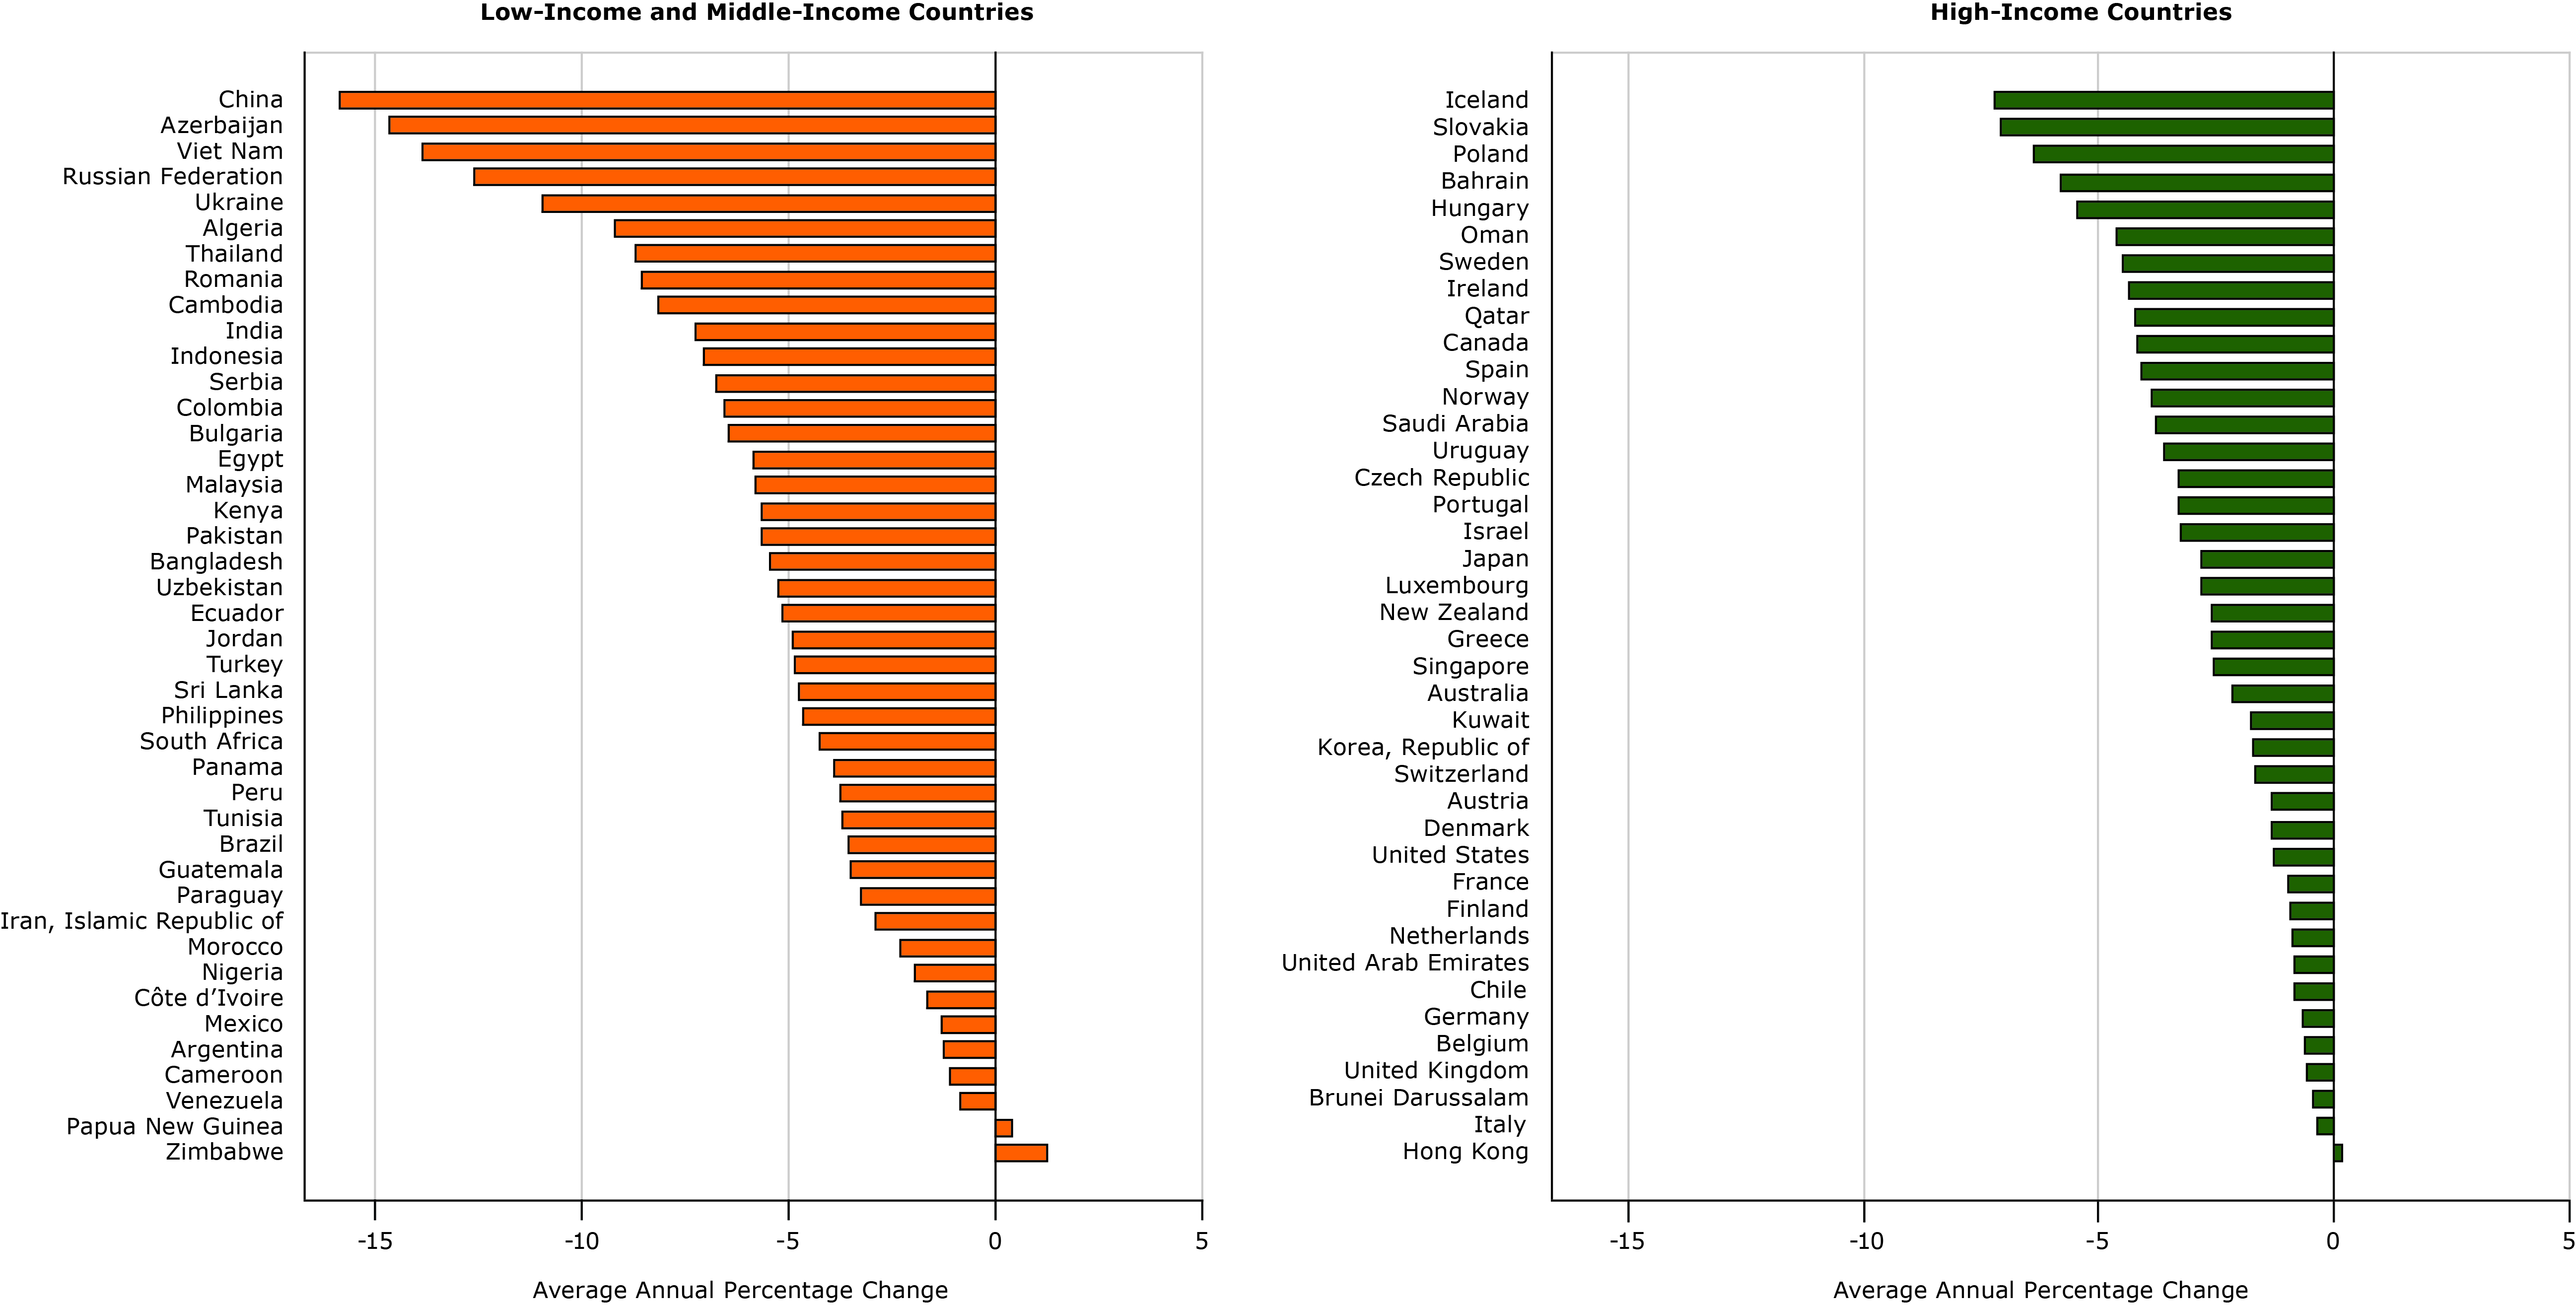
Figure 4. Average annual percentage change in relative-income price of sugar-sweetened beverages in 40 high-income and 42 low-income and middle-income countries from 1990 to 2016. [A text version of this figure is also available.]
The country with the largest annual average increase in affordability (or negative average annual percentage change of relative-income price) between 1990 and 2016 was China (Figure 5), where prices declined and incomes increased (income was inverted so it appears negative, but is in fact positive to the same magnitude). Conversely, prices increased on average annually in the Islamic Republic of Iran (hence a positive value in the figure) and so did income (again plotted as a negative value with respect to affordability), but because the increase in income was greater than the increase in price, affordability increased and relative-income price declined.
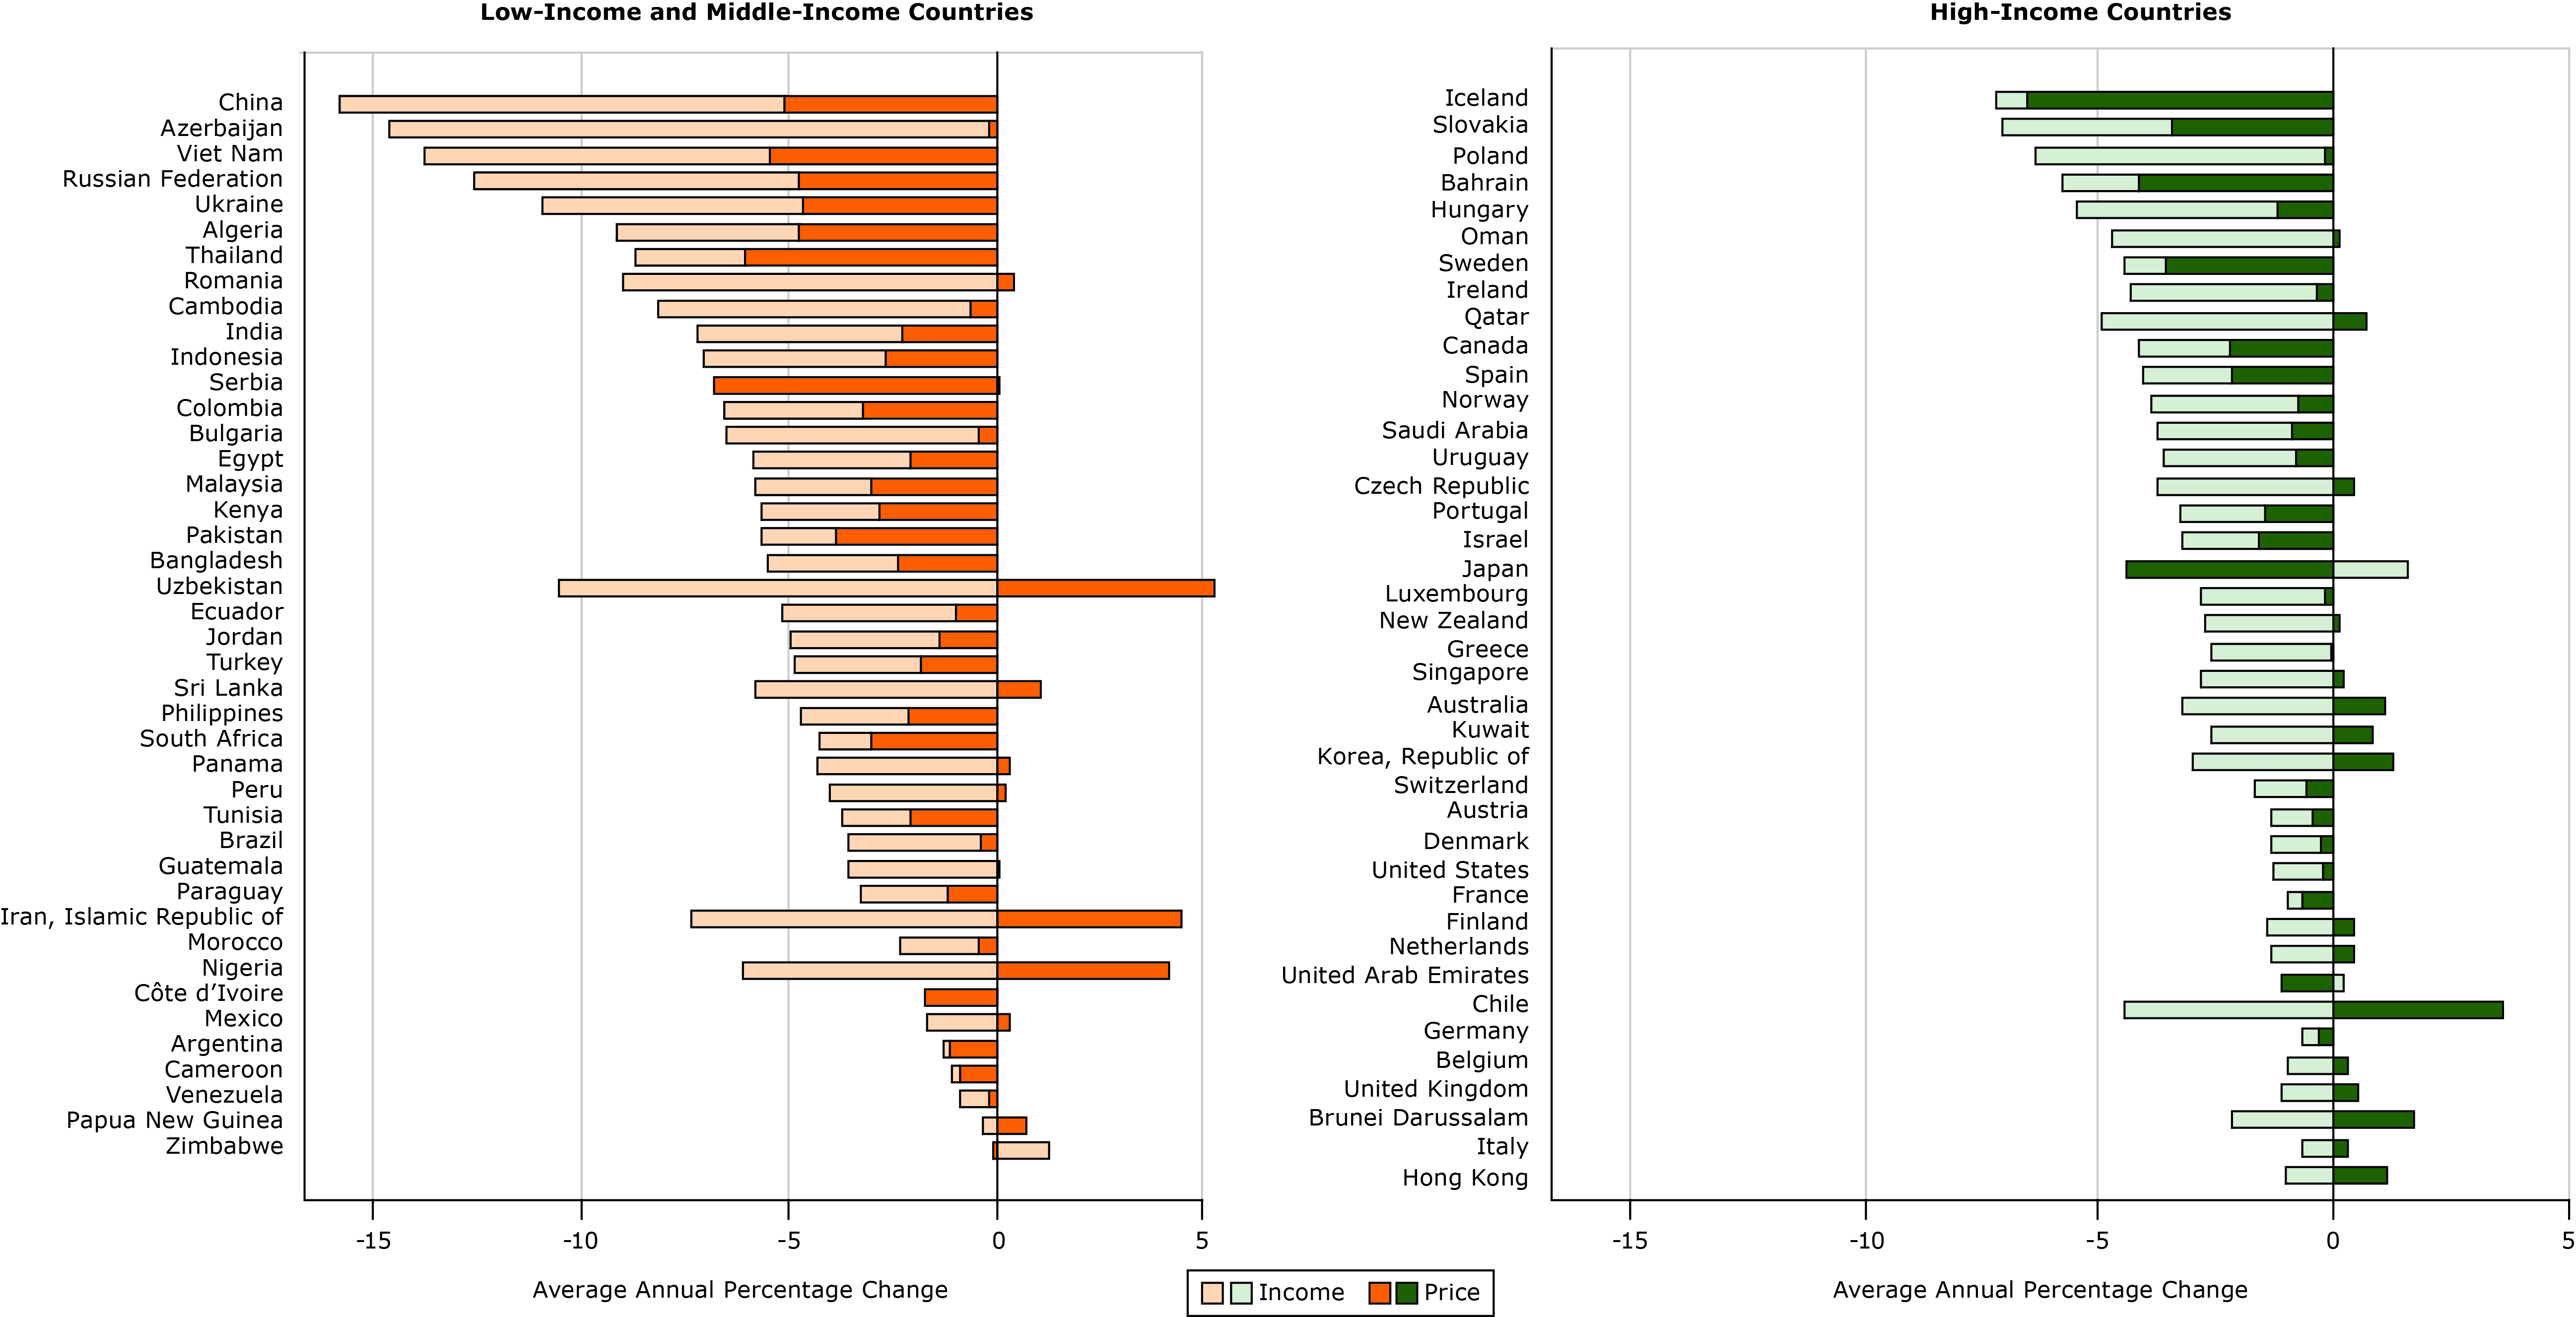
Figure 5. Decomposition of effects of income and price of sugar-sweetened beverages in 40 high-income and 42 low-income and middle-income countries from 1990 to 2016. Units are average annual percentage change. [A tabular version of this figure is also available.]
Affordability increased in most countries because of a combination of increases in income and decreases in price (Figure 5). Price increases counteracted income increases in only 10 of 42 LMICs and 16 of 40 HICs; however, in all these countries, the increases in prices were not large enough to make sugar-sweetened beverages less affordable. Prices decreased and incomes increased simultaneously in most countries (29 of 42 LMICs and 22 of 40 HICs), increasing affordability. In 9 LMICs and 6 HICs, declining prices contributed more than increasing incomes to the increasing affordability, while in 29 LMICs and 31 HICs increases in incomes contributed more to increases in affordability. Thus, the increases in affordability over time tended to be driven more by developments in income rather than developments in prices.
Discussion
Sugar-sweetened beverages became more affordable during the 27-year period from 1990 to 2016 in 79 of 82 countries in our data sample. If income had not grown, the changes in prices would have informed us about trends in consumption, but as our research shows, many countries, particularly LMICs, experienced high rates of economic growth in the last 2 decades. The average annual per capita GDP growth in LMICs was 6.07%, while the average annual per capita GDP growth in HICs was 1.27%. As such, growth in income may outweigh increases in prices, and hence the need to consider the changes in affordability over time. From an economic development perspective, policy makers want to engender income growth, so this dynamic reinforces the concept that governments will need to pursue policy interventions on the price side — not the income side — to affect affordability, for example, as many have done with cigarettes through effective excise taxation.
Although the increase in affordability is partly due to economic progress that resulted from rapid global economic development, it is also attributable to a lack of action taken by policy makers to affect the price of sugar-sweetened beverages, for example, through targeted excise tax increases. This inaction is arguably predictable because the idea of taxing sugar-sweetened beverages arose in the health economics literature late during the study period and has not progressed to become a widely adopted policy option (20) even at the time of writing in early 2017. For example, the implementation of such taxes in France in 2012, Hungary in 2011, and Mexico in 2014 may have occurred too late in the study period to make a meaningful impact on our results.
We argue, and the scientific literature strongly suggests, that this environment of increasingly affordable sugar-sweetened beverages will inevitably drive increased consumption of such products and will certainly hamper global efforts to address the overweight and obesity epidemic. Although sugar-sweetened beverages are not the sole consumer product contributing to the epidemic, their role as a major contributor is difficult to dispute. Just as in the fight against tobacco use, all options for effective intervention deserve consideration. Our research identifies a measureable problem that is contributing to the obesity epidemic and suggests that using affordability as an indicator of policy progress or failure can point policy makers in the right direction for creating price-focused policy interventions. Finally, without deliberate policy action to raise prices, sugar-sweetened beverages are likely to continue to become more affordable and thus more widely consumed around the world.
Policy options to affect the prices of sugar-sweetened beverages might include imposing, restructuring, or increasing excise taxes; mandating a minimum unit price; or preventing discounted products. Some countries, including Mexico, France, and Hungary, have already begun using excise taxes to increase the price of sugar-sweetened beverages (40,41), and preliminary findings from Mexico indicate that their sugar-sweetened beverage excise tax has driven down consumption of sugar-sweetened beverages (40,42).
Policy makers are now using affordability as a measure of progress in cigarette tax policy to significant positive effect (30). The most fundamental barrier to being able to use the tools of affordability to address sugar-sweetened beverage consumption is the willingness to identify sugar-sweetened beverage consumption as a threat to public health that necessitates policy remedy. Such a policy remedy can be taken to intentionally raise the price of sugar-sweetened beverages to keep pace with and eventually outstrip gains in income to make the products less affordable and in turn, consumed less over time.
Although this research demonstrates unequivocally that sugar-sweetened beverages have become more affordable in nearly every corner of the globe, skeptics may suggest that if income is the main driver of affordability in this context then most goods are becoming more affordable. Moreover, this issue could be particularly relevant to substitutes or near-substitutes, some of which could be healthier alternatives to sugar-sweetened beverages. Accordingly, we compared trends for bottled water and sugar-sweetened beverages to provide a control to our examination of sugar-sweetened beverage prices and found that bottled water is typically more expensive and less affordable than sugar-sweetened beverages ( Appendix).
Our analysis was somewhat constrained by the available data. We had data for 82 countries, which means that dozens of countries, mainly LMICs, were not included in our analysis, although we had no a priori reason to assume that these countries were different from the LMICs in the sample. Consistent price data were available from 1990 only. The price data were for Coca-Cola only; this product may be priced slightly differently than other brands. We used GDP per capita to calculate relative-income price, a measure with both strengths and weaknesses, discussed above.
The increasing worldwide affordability of sugar-sweetened beverages is likely having an effect on the global overweight and obesity epidemic. More affordable products lead to greater consumption, and increased consumption of sugar-sweetened beverages contributes to overweight and obesity. The change in affordability is a function of declining prices in many countries and increasing incomes. Societies typically want to engender growth, so the logical intervention is for governments to affect prices through excise taxation, as they have done with other unhealthful products such as cigarettes.
Acknowledgments
The American Cancer Society purchased the data for the research and supported all researchers during the analysis and writing of this article. The authors report no conflicts of interest of any kind (financial or otherwise). This study used aggregate economic data and was exempt from ethics approval according to the American Cancer Society Institutional Review Board of record, the Morehouse School of Medicine.
Author Information
Corresponding Author: Jeffrey M. Drope, PhD, American Cancer Society, 250 Williams St, Quad 4D, Atlanta, GA 30303. Telephone: 404-329-7618. Email: jeffrey.drope@cancer.org.
Author Affiliations: 1Institute for Health Research and Policy, University of Illinois at Chicago, Chicago, Illinois. 2Economic and Health Policy Research, American Cancer Society, Atlanta, Georgia. 3Independent Consultant, Palo Alto, California.
References
- Duffey KJ, Popkin BM. Shifts in patterns and consumption of beverages between 1965 and 2002. Obesity (Silver Spring) 2007;15(11):2739–47. CrossRef PubMed
- Barquera S, Hernandez-Barrera L, Tolentino ML, Espinosa J, Ng SW, Rivera JA, et al. Energy intake from beverages is increasing among Mexican adolescents and adults. J Nutr 2008;138(12):2454–61. CrossRef PubMed
- Popkin BM. The world is fat: the fads, trends, policies, and products that are fattening the human race. New York (NY): Penguin; 2009. 248 p.
- Malik VS, Popkin BM, Bray GA, Després J-P, Hu FB. Sugar-sweetened beverages, obesity, type 2 diabetes mellitus, and cardiovascular disease risk. Circulation 2010;121(11):1356–64.CrossRef PubMed
- Hu FB, Malik VS. Sugar-sweetened beverages and risk of obesity and type 2 diabetes: epidemiologic evidence. Physiol Behav 2010;100(1):47–54. CrossRef PubMed
- Miller PE, McKinnon RA, Krebs-Smith SM, Subar AF, Chriqui J, Kahle L, et al. Sugar-sweetened beverage consumption in the U.S.: novel assessment methodology. Am J Prev Med 2013;45(4):416–21. CrossRef PubMed
- Malik VS, Schulze MB, Hu FB. Intake of sugar-sweetened beverages and weight gain: a systematic review. Am J Clin Nutr 2006;84(2):274–88. PubMed
- Malik VS, Popkin BM, Bray GA, Després J-P, Willett WC, Hu FB. Sugar-sweetened beverages and risk of metabolic syndrome and type 2 diabetes: a meta-analysis. Diabetes Care 2010;33(11):2477–83. CrossRef PubMed
- Ng M, Fleming T, Robinson M, Thomson B, Graetz N, Margono C, et al. Global, regional, and national prevalence of overweight and obesity in children and adults during 1980–2013: a systematic analysis for the Global Burden of Disease Study 2013. Lancet 2014;384(9945):766–81. CrossRef PubMed
- Lim SS, Vos T, Flaxman AD, Danaei G, Shibuya K, Adair-Rohani H, et al. A comparative risk assessment of burden of disease and injury attributable to 67 risk factors and risk factor clusters in 21 regions, 1990–2010: a systematic analysis for the Global Burden of Disease Study 2010. Lancet 2012;380(9859):2224–60. Erratum in: Lancet 2013;381(9867):628. Erratum in: Lancet 2013;381(9874):1276. CrossRef PubMed
- Credit Suisse. Sugar consumption at a crossroads. 2013. https://publications.credit-suisse.com/tasks/render/file/index.cfm?fileid=780BF4A8-B3D1-13A0-D2514E21EFFB0479. Accessed February 15, 2017.
- Andreyeva T, Long MW, Brownell KD. The impact of food prices on consumption: a systematic review of research on the price elasticity of demand for food. Am J Public Health 2010;100(2):216–22. CrossRef PubMed
- Zhen C, Finkelstein EA, Nonnemaker J, Karns S, Todd JE. Predicting the effects of sugar-sweetened beverage taxes on food and beverage demand in a large demand system. Am J Agric Econ 2014;96(1):1–25. CrossRef PubMed
- Urzúa CM. Evaluación de los efectos distributivos y espaciales de las empresas con poder de mercado en México. Mex Fed Compet Comm. 2008. http://search.oecd.org/daf/competition/45047597.pdf. Accessed January 10, 2017.
- Han E, Powell LM. Consumption patterns of sugar-sweetened beverages in the United States. J Acad Nutr Diet 2013;113(1):43–53. CrossRef PubMed
- Finkelstein EA, Zhen C, Nonnemaker J, Todd JE. Impact of targeted beverage taxes on higher- and lower-income households. Arch Intern Med 2010;170(22):2028–34. CrossRef PubMed
- Jou J, Techakehakij W. International application of sugar-sweetened beverage (SSB) taxation in obesity reduction: factors that may influence policy effectiveness in country-specific contexts. Health Policy 2012;107(1):83–90. CrossRef PubMed
- Brownell KD, Farley T, Willett WC, Popkin BM, Chaloupka FJ, Thompson JW, et al. The public health and economic benefits of taxing sugar-sweetened beverages. N Engl J Med 2009;361(16):1599–605. CrossRef PubMed
- World Health Organization. Fiscal policies for diet and prevention of noncommunicable diseases: technical meeting report, 5–6 May 2015, Geneva, Switzerland. http://apps.who.int/iris/handle/10665/250131. Accessed January 10, 2017.
- Friedman R, Brownell K. Sugar-sweetened beverage taxes: an updated policy brief 2012. University of Connecticut Rudd Center for Food Policy & Obesity. http://bit.ly/1KKynmh. Accessed July 6, 2015.
- Nestle M. Food politics: how the food industry influences nutrition and health. Vol. 3. Berkeley (CA): University of California Press; 2013. https://books.google.com/books?hl=en&lr=&id=39oVBbtt6IEC&oi=fnd&pg=PP1&dq=Food+Politics:+How+the+Food+Industry+Influences+Nutrition+and+Health&ots=2X4KcaXILC&sig=hcIJvIzXJFOHimPN6IVC5kMoltg. Accessed January 10, 2017.
- Statista. Largest global advertisers 2013. http://www.statista.com/statistics/286448/largest-global-advertisers/. Accessed June 3, 2015.
- Within an arm’s reach of desire: a Coca-Cola Great Britain case study. http://businesscasestudies.co.uk/coca-cola-great-britain/within-an-arms-reach-of-desire/marketing-strategy.html#axzz3ZH82LnrO. Accessed February 15, 2017.
- Powell LM, Chaloupka FJ. Food prices and obesity: evidence and policy implications for taxes and subsidies. Milbank Q 2009;87(1):229–57. CrossRef PubMed
- Philipson TJ, Posner RA. Is the obesity epidemic a public health problem? A review of Zoltan J. Acs and Alan Lyles’s Is the obesity epidemic a public health problem? A review of Zoltan J. Acs and Alan Lyles’s Obesity, Business and Public Policy. J Econ Lit 2008;46(4):974–82. CrossRef
- Rodríguez-Iglesias G, González-Rozada M, Champagne BM, Schoj V. Real price and affordability as challenges for effective tobacco control policies: an analysis for Argentina. Rev Panam Salud Publica 2015;37(2):98–103. PubMed
- Guindon GE, Tobin S, Yach D. Trends and affordability of cigarette prices: ample room for tax increases and related health gains. Tob Control 2002;11(1):35–43. CrossRef PubMed
- Bandi P, Blecher E, Cokkinides V, Ross H, Jemal A. Cigarette affordability in the United States. Nicotine Tob Res 2013;15(9):1484–91. CrossRef PubMed
- Blecher EH, van Walbeek CP. An international analysis of cigarette affordability. Tob Control 2004;13(4):339–46. CrossRef PubMed
- Blecher EH, van Walbeek CP. Cigarette affordability trends: an update and some methodological comments. Tob Control 2009;18(3):167–75. CrossRef PubMed
- Kan M-Y, Lau M. Comparing alcohol affordability in 65 cities worldwide. Drug Alcohol Rev 2013;32(1):19–26. CrossRef PubMed
- Nelson JP. Alcohol affordability and alcohol demand: cross-country trends and panel data estimates, 1975 to 2008. Alcohol Clin Exp Res 2014;38(4):1167–75. CrossRef PubMed
- Ghosh P, Ghosh K, Tiwari RC. Bayesian approach to cancer-trend analysis using age-stratified Poisson regression models. Stat Med 2011;30(2):127–39. CrossRef PubMed
- Atkinson AB. Factor shares: the principal problem of political economy? Oxf Rev Econ Policy 2009;25(1):3–16. CrossRef
- Chien Y, Arias MA. Lagging long-term wage growth. Econ Synop 2015. https://research.stlouisfed.org/publications/economic-synopses/2015/06/24/lagging-long-term-wage-growth/. Accessed January 10, 2017.
- Euromonitor International. Passport: global market information database. London (UK): Euromonitor International; 2014.
- Taylor FC, Satija A, Khurana S, Singh G, Ebrahim S. Pepsi and Coca Cola in Delhi, India: availability, price and sales. Public Health Nutr 2011;14(4):653–60. CrossRef PubMed
- The Economist Intelligence Unit. World Cost of Living Survey 2017. London (UK): The Economist Intelligence Unit. https://www.worldwidecostofliving.com/asp/wcol_WCOLHome.asp. Accessed February 27, 2017.
- International Monetary Fund. World Economic Outlook Database. Washington (DC): International Monetary Fund. https://www.imf.org/external/pubs/ft/weo/2016/02/weodata/index.aspx. Accessed February 27, 2017.
- Colchero M, Rivera J. Reducción en el consumo de bebidas con impuesto después de la implementación del impuesto en México. México Instituto Nacional de Salud Pública. 2015. Spanish. http://www.insp.mx/epppo/blog/3659-reduccion-consumo-bebidas.html. Accessed June 16, 2015.
- Karanikolos M, Mladovsky P, Cylus J, Thomson S, Basu S, Stuckler D, et al. Financial crisis, austerity, and health in Europe. Lancet 2013;381(9874):1323–31. CrossRef PubMed
- Colchero MA, Popkin BM, Rivera JA, Ng SW. Beverage purchases from stores in Mexico under the excise tax on sugar sweetened beverages: observational study. BMJ 2016;352:h6704.CrossRef PubMed
- Wang YC, Bleich SN, Gortmaker SL. Increasing caloric contribution from sugar-sweetened beverages and 100% fruit juices among US children and adolescents, 1988–2004. Pediatrics 2008;121(6):e1604–14. CrossRef PubMed
- Shepherd R, Farleigh CA. Attitudes and personality related to salt intake. Appetite 1986;7(4):343–54. CrossRef PubMed
- Wardle J. Food choices and health evaluation. Psychol Health 1993;8(1):65–75. CrossRef


.png)
.png)


No hay comentarios:
Publicar un comentario