NCHS Health E-Stat
Recent Trends in Births and Fertility Rates Through June 2012
by Brady E. Hamilton, Ph.D., and Paul D. Sutton, Ph.D., Division of Vital StatisticsOn this Page
 (73 KB)
The provisional count of births in the United States for the 12-month period ending June 2012 was 3,942,000, which was 1% lower than the 3,981,000 births (provisional count) for the 12-month period ending June 2011 (1). The number of births has steadily declined from the historic high of 4,316,233 in 2007 (Figure) (2,3), but the rate of decline has slowed from 2010 through June 2012.
The provisional fertility rate in the United States for the 12-month period ending June 2012 declined 1% to 63.0 births per 1,000 women aged 15–44 from 63.8 for the 12-month period ending June 2011 (1). Like the number of births, the fertility rate has steadily declined from the recent high of 69.3 in 2007 (Figure) (2,3), although, again, the rate of decline has slowed from 2010 through June 2012.
Data sources and methods
Provisional counts and rates are based on 12 months of provisional data ending with the specified month. Provisional counts are rounded to the nearest thousand. For further information about provisional data, see Births, Marriages, Divorces, and Deaths: Provisional Data for 2009 (4). Data for 2005–2010 in the figure are final, data for 2011 are preliminary, and data for the 12 months ending June 2012 are provisional (1-3).References
- 1. National Center for Health Statistics. Provisional monthly and 12-month ending number of live births, deaths, and infant deaths and rates: United States, January 2011–June 2012
- Hamilton BE, Martin JA, Ventura SJ. Births: Preliminary data for 2011
- Martin JA, Hamilton BE, Ventura SJ, et al. Births: Final data for 2010
- Tejada-Vera B, Sutton PD. Births, marriages, divorces, and deaths: Provisional data for 2009
Figure
Figure. Birth and fertility rates: United States, final 2005–2010, preliminary 2011, and provisional for the 12 months ending June 2012
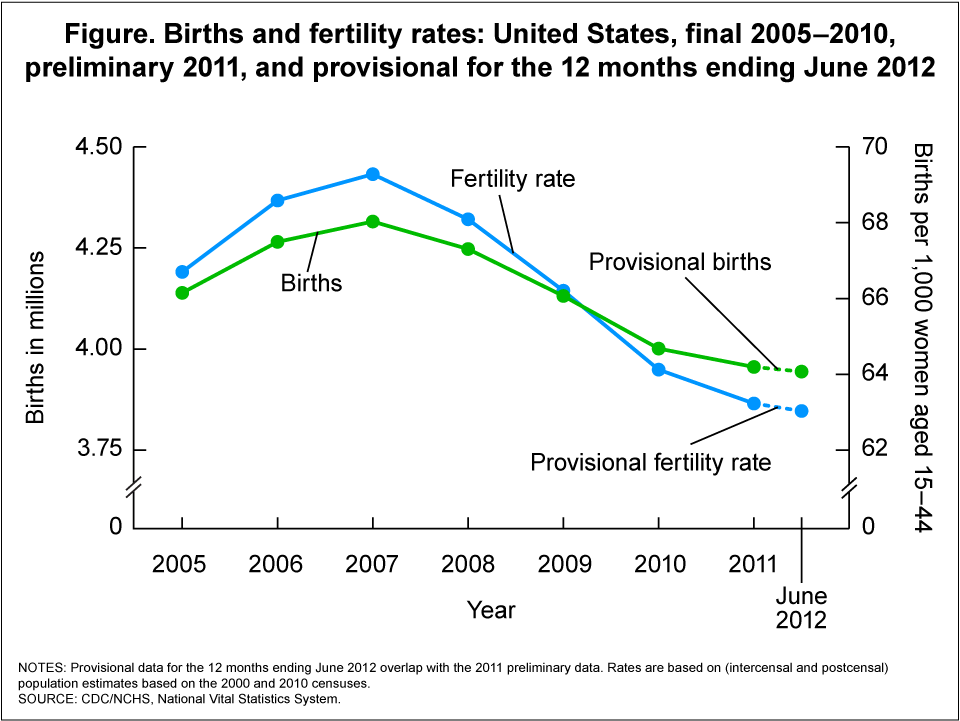
NOTES: Provisional data for the 12 months ending June 2012 overlap with the 2011 preliminary data. Rates are based on (intercensal and postcensal) population estimates based on the 2000 and 2010 census.
SOURCE: CDC/NCHS, Nation Vital Statistics System.


No hay comentarios:
Publicar un comentario