NCHS Data Brief
Number 100, July 2012
Multiple Chronic Conditions Among Adults Aged 45 and Over: Trends Over the Past 10 Years
On This Page
- Key findings
- The percentage of adults aged 45–64 and 65 and over with two or more of nine selected chronic conditions increased between 1999–2000 and 2009–2010.
- The percentage of adults aged 45 and over with two or more of nine selected chronic conditions increased for all racial and ethnic groups between 1999–2000 and 2009–2010.
- During the 10-year period, the prevalence of two or more of nine selected chronic conditions increased for adults aged 45 and over in most family income groups.
- The percentage of adults aged 45 and over with the three most common combinations of the nine selected chronic conditions increased over the 10-year period.
- The percentage of adults aged 45–64 with two or more of nine selected chronic conditions who did not receive or delayed needed medical care in the past year due to cost, or who did not receive needed prescription drugs in the past year due to cost, increased over the 10-year period.
- Summary
- Definition
- Data sources and methods
- About the authors
- References
- Suggested citation
 (727 KB)
Virginia M. Freid, M.S.; Amy B. Bernstein, Sc.D.; and Mary Ann Bush, M.S.
Key findings
Data from the National Health Interview Survey, 1999–2000 and 2009–2010- Between 1999–2000 and 2009–2010, the percentage of adults aged 45–64 and 65 and over with two or more of nine selected chronic conditions increased for both men and women, all racial and ethnic groups examined, and most income groups.
- During the 10-year period, the percentage of adults aged 65 and over with both hypertension and diabetes increased from 9% to 15%; prevalence of hypertension and heart disease increased from 18% to 21%; and prevalence of hypertension and cancer increased from 8% to 11%.
- The percentage of adults aged 45–64 with two or more of nine selected chronic conditions who did not receive or delayed needed medical care due to cost increased from 17% to 23%, and the percentage who did not receive needed prescription drugs due to cost increased from 14% to 22%.
Keywords: hypertension, diabetes, cancer, prevalence
The percentage of adults aged 45–64 and 65 and over with two or more of nine selected chronic conditions increased between 1999–2000 and 2009–2010.
Figure 1. Prevalence of two or more of nine selected chronic conditions among adults aged 45 and over, by age and sex: United States, 1999–2000 and 2009–2010
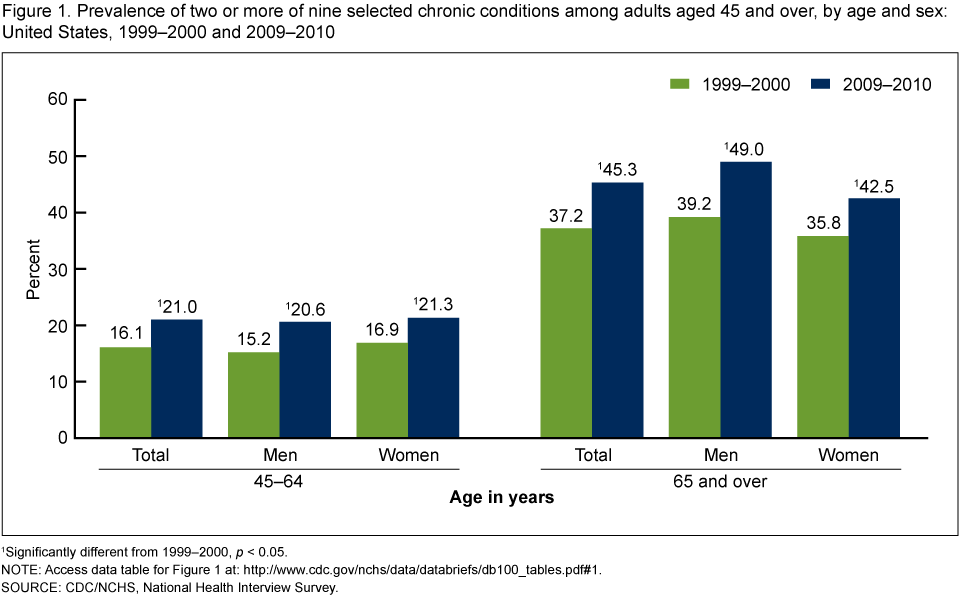
1Significantly different from 1999–2000, p < 0.05.
NOTE: Access data table for Figure 1 [PDF - 146 KB].
SOURCE: CDC/NCHS, National Health Interview Survey.
NOTE: Access data table for Figure 1
[PDF - 146 KB].SOURCE: CDC/NCHS, National Health Interview Survey.
- The percentage of adults with two or more chronic conditions increased for men and women in both age groups during the 10-year period (Figure 1).
- In 2009–2010, 21% of adults aged 45–64 and 45% of adults aged 65 and over had been diagnosed with two or more chronic conditions.
The percentage of adults aged 45 and over with two or more of nine selected chronic conditions increased for all racial and ethnic groups between 1999–2000 and 2009–2010.
Figure 2. Prevalence of two or more of nine selected chronic conditions among adults aged 45 and over, by age and race and Hispanic origin: United States, 1999–2000 and 2009–2010
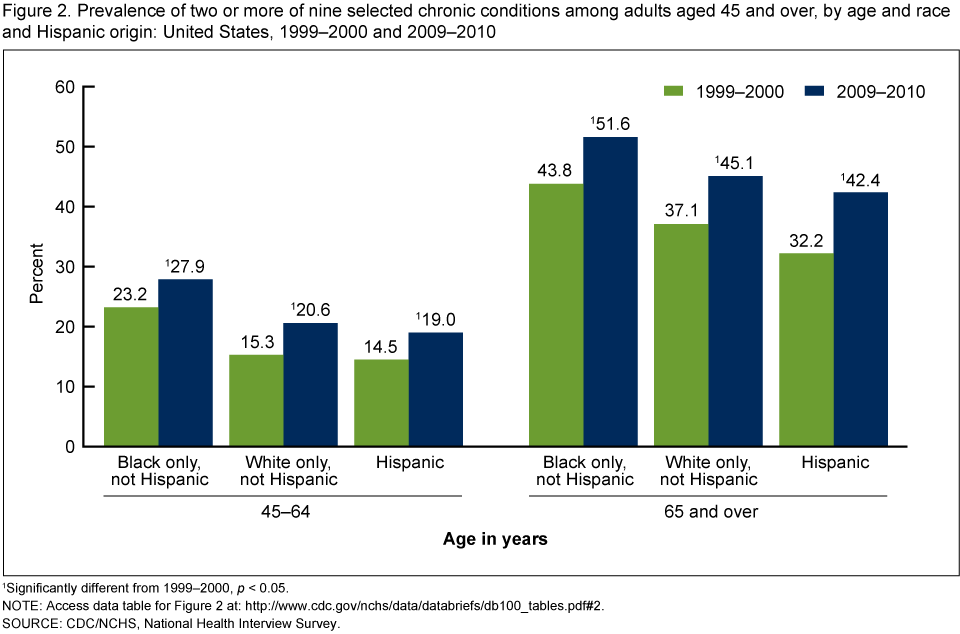
1Significantly different from 1999–2000, p < 0.05.
NOTE: Access data table for Figure 2 [PDF 146 KB].
SOURCE: CDC/NCHS, National Health Interview Survey.
NOTE: Access data table for Figure 2
[PDF 146 KB].SOURCE: CDC/NCHS, National Health Interview Survey.
- Between 1999–2000 and 2009–2010, the percentage of adults aged 45–64 with two or more chronic conditions increased 20% for non-Hispanic black, 35% for non-Hispanic white, and 31% for Hispanic adults (Figure 2).
- During this period, the prevalence of two or more chronic conditions among those aged 65 and over increased 18% for non-Hispanic black, 22% for non-Hispanic white, and 32% for Hispanic adults.
- In both time periods, the prevalence of two or more chronic conditions was higher among non-Hispanic black adults than among adults in other racial and ethnic groups.
During the 10-year period, the prevalence of two or more of nine selected chronic conditions increased for adults aged 45 and over in most family income groups.
Figure 3. Prevalence of two or more of nine selected chronic conditions among adults aged 45 and over, by age and percentage of poverty level: United States, 1999–2000 and 2009–2010
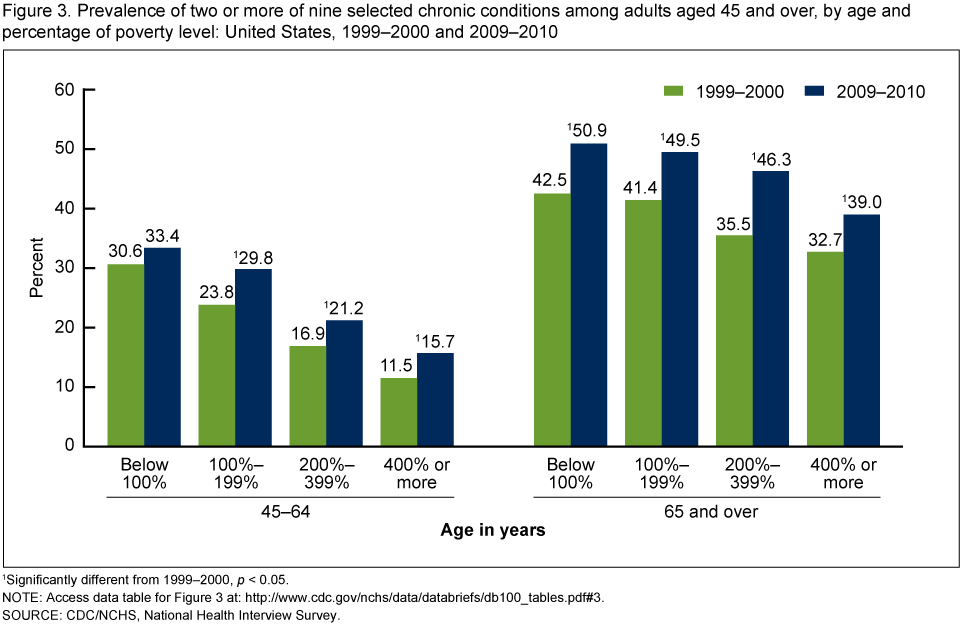
1Significantly different from 1999–2000, p < 0.05.
NOTE: Access data table for Figure 3 [PDF 146 KB].
SOURCE: CDC/NCHS, National Health Interview Survey.
NOTE: Access data table for Figure 3
[PDF 146 KB].SOURCE: CDC/NCHS, National Health Interview Survey.
- In both 1999–2000 and 2009–2010, the prevalence of two or more chronic conditions for adults aged 45–64 decreased with rising family income and was more than twice as high among those living in poverty as among those at 400% or more of the poverty level (Figure 3).
- Among those aged 65 and over, the percentage with two or more chronic conditions also decreased with increasing family income, but the percentage varied less by family income than among those aged 45–64.
The percentage of adults aged 45 and over with the three most common combinations of the nine selected chronic conditions increased over the 10-year period.
Figure 4. Prevalence of the three most common combinations of the nine selected chronic conditions, by age and type of chronic condition: United States, 1999–2000 and 2009–2010
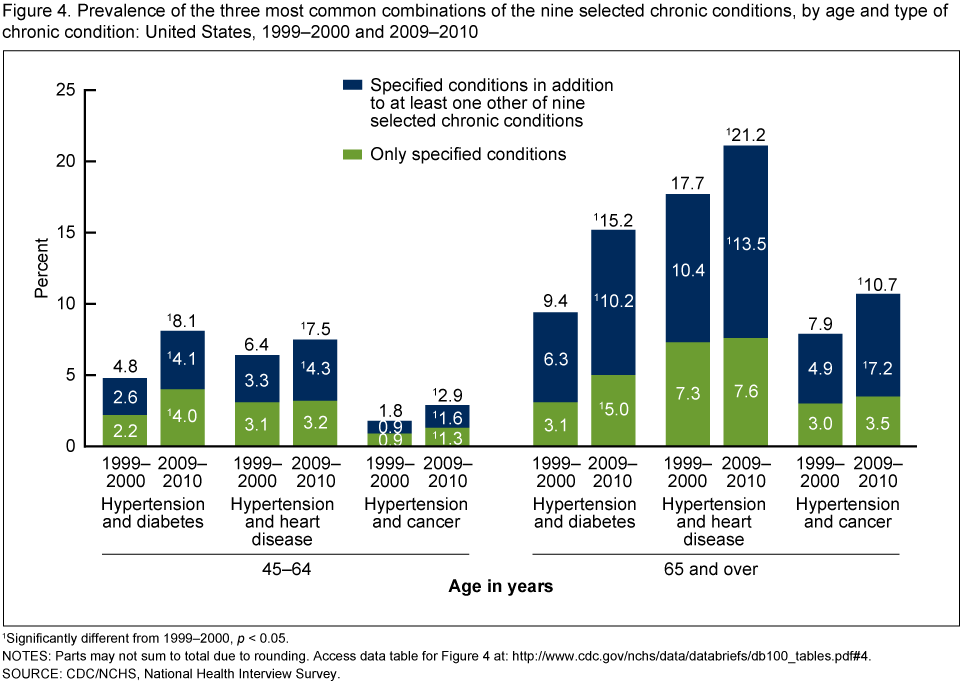
1Significantly different from 1999–2000, p < 0.05.
NOTES: Parts may not sum to total due to rounding. Access data table for Figure 4 [PDF - 146 KB].
SOURCE: CDC/NCHS, National Health Interview Survey.
NOTES: Parts may not sum to total due to rounding. Access data table for Figure 4
[PDF - 146 KB].SOURCE: CDC/NCHS, National Health Interview Survey.
- Between 1999–2000 and 2009–2010, the percentage of adults aged 45–64 with both hypertension and diabetes increased from 5% to 8% because of an increase in the share with hypertension and diabetes only, as well as an increase in the share with hypertension, diabetes, and additional chronic condition(s) (Figure 4).
- During the 10-year period, the percentage of adults aged 65 and over with both hypertension and diabetes rose from 9% to 15%; prevalence of hypertension and heart disease increased from 18% to 21%; and prevalence of hypertension and cancer increased from 8% to 11%.
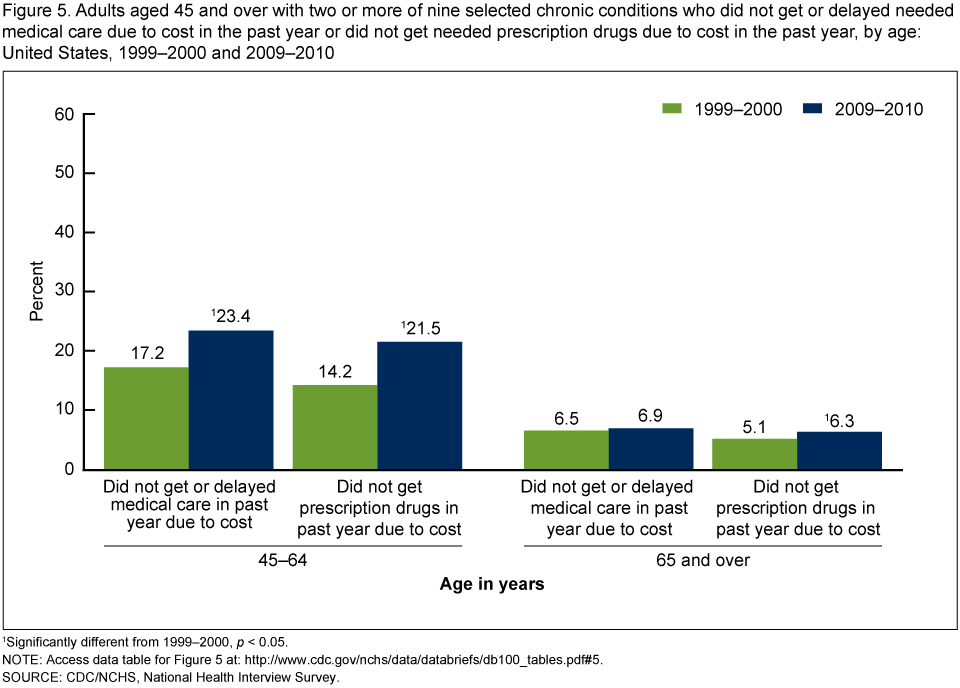
The percentage of adults aged 45–64 with two or more of nine selected chronic conditions who did not receive or delayed needed medical care in the past year due to cost, or who did not receive needed prescription drugs in the past year due to cost, increased over the 10-year period.
Figure 5. Adults aged 45 and over with two or more of nine selected chronic conditions who did not get or delayed needed medical care due to cost in the past year or did not get needed prescription drugs due to cost in the past year, by age: United States, 1999–2000 and 2009–2010
1Significantly different from 1999–2000, p < 0.05.
NOTE: Access data table for Figure 5 [PDF - 146 KB].
SOURCE: CDC/NCHS, National Health Interview Survey.
NOTE: Access data table for Figure 5
[PDF - 146 KB].SOURCE: CDC/NCHS, National Health Interview Survey.
- In 2009–2010, 23% of adults aged 45–64 with two or more chronic conditions did not receive or delayed needed medical care in the past year due to cost, and 22% did not receive needed prescription drugs due to cost (Figure 5).
- For adults aged 65 and over with two or more chronic conditions, there was no change in the percentage who did not receive or delayed needed medical care in the past year due to cost, while the percentage who did not receive needed prescription drugs in the past year due to cost increased over the 10-year period.
Summary
These findings demonstrate the widespread rise in the prevalence of two or more of nine selected chronic conditions over a 10-year period. The most common combinations of chronic conditions—hypertension and diabetes, hypertension and heart disease, and hypertension and cance—rincreased during this time. Between 1999–2000 and 2009–2010, adults aged 45–64 with two or more chronic conditions had increasing difficulty obtaining needed medical care and prescription drugs because of cost.Growth in the prevalence of MCC was driven primarily by increases in three of the nine individual conditions. During this 10-year period, prevalence of hypertension increased from 35% to 41%, diabetes from 10% to 15%, and cancer from 9% to 11%, among those aged 45 and over. A limitation of this report is that it includes only respondent-reported information of a physician diagnosis; thus, estimates may be understated because they do not include undiagnosed chronic conditions.
Increases in the prevalence of MCC may be due to a rise in new cases (incidence) or longer duration with chronic conditions. The prevalence of obesity—a risk factor for certain types of heart disease and cancer, hypertension, stroke, and diabetes—increased in the United States over the past 30 years, but has leveled off in recent years (7–9). Advances in medical treatments and drugs are contributing to increased survival for persons with some chronic conditions. During this 10-year period, death rates for heart disease, cancer, and stroke declined (9). In recent years, the percentage of Americans who were aware of their hypertension, and the use of hypertension medications, has increased (8).
The rising prevalence of MCC has implications for the financing and delivery of health care. Persons with MCC are more likely to be hospitalized, fill more prescriptions and have higher annual prescription drug costs, and have more physician visits (3). Out-of-pocket spending is higher for persons with multiple chronic conditions and has increased in recent years (5).
Chronic disease, and combinations of chronic diseases, affects individuals to varying degrees and may impact an individual's life in different ways. The increasing prevalence of MCC presents a complex challenge to the U.S. health care system, both in terms of quality of life and expenditures for an aging population.
Definition
Multiple chronic conditions: Based on respondent's reports to the following set of individual questions that were consistent over the 10-year period examined: "Have you ever been told by a doctor or other health professional that you had hypertension…coronary heart disease…angina…a heart attack…any kind of heart condition or heart disease (other than the ones I just asked about)…diabetes…stroke…emphysema…cancer?" Respondents were also asked these questions about the past year: "During the past 12 months, have you had an episode of asthma, or were you told by a doctor or other health professional that you had chronic bronchitis or weak kidneys?" For hypertension, respondents had to have been told on two or more different visits. Adults who responded "borderline diabetes" were recoded as "no" to diabetes. Adults who responded in the affirmative to only "non-melanoma" skin cancer were recoded as "no" for cancer. The four heart disease questions were combined into one variable and considered as one chronic condition. Other definitions of MCC are used in the literature and differ based on analytic objectives and the data sources used in the analyses (2,3).Data sources and methods
Estimates in this report are based on NHIS data, which provide information on the health status of the civilian noninstitutionalized population of the United States. Questions about all nine of the selected chronic conditions were answered by 30,682 respondents in 1999–2000 and 29,523 respondents in 2009–2010. For more information about NHIS, including the questionnaires used, visit the NHIS website.Differences between subgroups were evaluated using the univariate t statistic. All significance tests were two sided, using p < 0.05 as the level of significance. All comparisons reported in the text are statistically significant unless otherwise indicated. Data analyses were performed using SAS version 9.1 (SAS Institute, Cary, N.C.) and SUDAAN version 9.0 (RTI International, Research Triangle Park, N.C.).
About the authors
Virginia M. Freid, Amy B. Bernstein, and Mary Ann Bush are with the Centers for Disease Control and Prevention's National Center for Health Statistics, Office of Analysis and Epidemiology.References
- Benjamin RM. Multiple chronic conditions: A public health challenge. Public Health Rep 125(5):626–7. 2010.
- Department of Health and Human Services. HHS initiative on multiple chronic conditions
.
- Anderson G. Chronic care: Making the case for ongoing care
- Wolff JL, Starfield B, Anderson G. Prevalence, expenditures, and complications of multiple chronic conditions in the elderly. Arch Intern Med 162(20):2269–76. 2002.
- Paez KA, Zhao L, Hwang W. Rising out-of-pocket spending for chronic conditions: A ten-year trend. Health Aff 28(1):15–25. 2009.
- Vogeli C, Shields AE, Lee TA, Gibson TB, Marder WD, Weiss KB, Blumenthal D. Multiple chronic conditions: Prevalence, health consequences, and implications for quality, care management, and costs. J Gen Intern Med 22(Suppl 3):391–5. 2007.
- Flegal KM, Carroll MD, Ogden CL, Curtin LR. Prevalence and trends in obesity among US adults, 1999–2008. JAMA 303(3):235–41. 2010.
- Yoon S, Ostchega Y, Louis T. Recent trends in the prevalence of high blood pressure and its treatment and control, 1999–2008. NCHS data brief, no 48. Hyattsville, MD: National Center for Health Statistics. 2010.
- National Center for Health Statistics. Health, United States, 2011: With special feature on socioeconomic status and health. Hyattsville, MD. 2012.
Suggested citation
Freid VM, Bernstein AB, Bush MA. Multiple chronic conditions among adults aged 45 and over: Trends over the past 10 years. NCHS data brief, no 100. Hyattsville, MD: National Center for Health Statistics. 2012.Copyright information
All material appearing in this report is in the public domain and may be reproduced or copied without permission; citation as to source, however, is appreciated.National Center for Health Statistics
Edward J. Sondik, Ph.D., DirectorJennifer H. Madans, Ph.D., Associate Director for Science
Office of Analysis and Epidemiology
Jennifer H. Madans, Ph.D., Acting co-DirectorJames M. Craver, M.A.A., Acting co-Director
Products - Data Briefs - Number 100 - July 2012


.png)


No hay comentarios:
Publicar un comentario