NCHS Data Brief
Number 110, November 2012
Calories Consumed From Alcoholic Beverages by U.S. Adults, 2007–2010
On This Page
- Key findings
- What percentage of adults consumes calories from alcoholic beverages?
- Are there differences by sex and age in mean calories consumed from alcoholic beverages?
- Do the mean calories consumed from alcoholic beverages differ by race and ethnicity?
- Are there differences by poverty level in mean calories consumed from alcoholic beverages?
- What types of alcoholic beverages are contributing the calories that adults consume?
- Summary
- Definitions
- Data sources and methods
- About the authors
- References
- Suggested citation
 (686 KB)
Samara Joy Nielsen, Ph.D., M.Div.; Brian K. Kit, M.D., M.P.H.; Tala Fakhouri, Ph.D., M.P.H.; and Cynthia L. Ogden, Ph.D., M.R.P.
Key findings
Data from the National Health and Nutrition Examination Survey, 2007–2010- The U.S. adult population consumes an average of almost 100 calories per day from alcoholic beverages.
- Men consume more calories from alcoholic beverages than women.
- Younger adults consume more calories from alcoholic beverages than older adults.
- Men consume more beer than other types of alcohol.
- Average calories consumed from alcoholic beverages do not differ by race and ethnicity.
Keywords: beer, wine, liquor, National Health and Nutrition Examination Survey
What percentage of adults consumes calories from alcoholic beverages?
On a given day, one-third of men and 18% of women consume calories from alcoholic beverages (Figure 1). Although 67% of men and 82% of women do not consume any alcoholic beverages on a given day, almost 20% of men and 6% of women consume more than 300 calories from alcoholic beverages, which is equivalent to 2 or more 12-ounce (oz) beers, more than 2½ glasses of wine (12.5 oz), or more than 4.5 oz of spirits (4).Figure 1. Percentage of adults aged 20 and over who consume alcoholic beverages on a given day, by sex and calories consumed: United States, 2007–2010
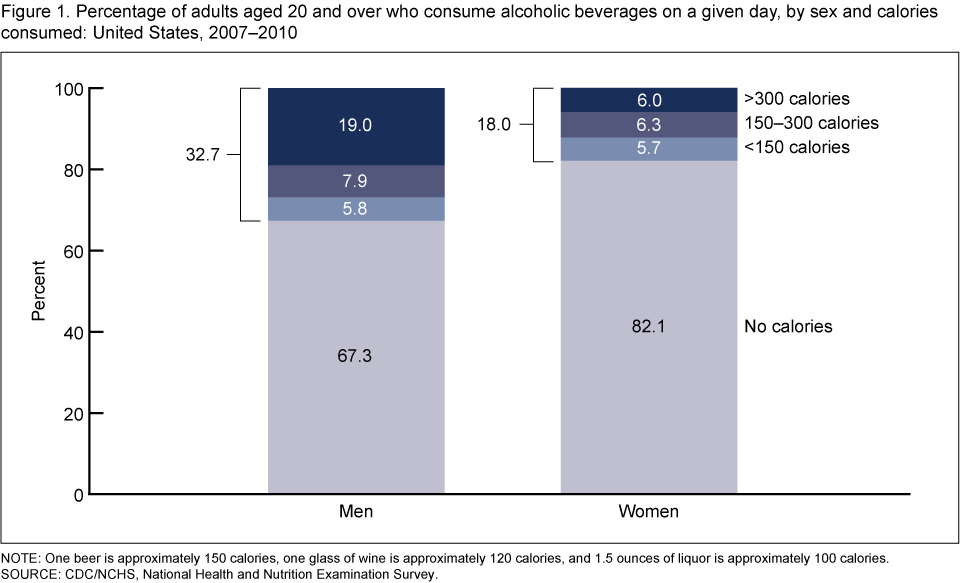
NOTE: One beer is approximately 150 calories, one glass of wine is approximately 120 calories, and 1.5 ounces of liquor is approximately 100 calories.
SOURCE: CDC/NCHS, National Health and Nutrition Examination Survey.
SOURCE: CDC/NCHS, National Health and Nutrition Examination Survey.
Are there differences by sex and age in mean calories consumed from alcoholic beverages?
The adult population consumes almost 100 calories per day on average from alcoholic beverages (Figure 2). Men consume more calories from alcoholic beverages than women; on average, men consume 150 calories while women consume a little over 50 calories. Men and women in older age groups consume fewer calories from alcoholic beverages. Young men, aged 20–39, consume almost 175 calories on average from alcoholic beverages, while older men, aged 60 and over, consume 96 calories. Similarly, women in age groups 20–39 and 40–59 consume about 60 alcohol calories on average, while older women consume about one-half of that amount—33 calories. On a given day, consumers of alcoholic beverages obtain approximately 16% of their total caloric intake from alcoholic beverages (not shown).Figure 2. Mean kilocalories from alcoholic beverages per day among adults aged 20 and over, by sex and age: United States, 2007–2010
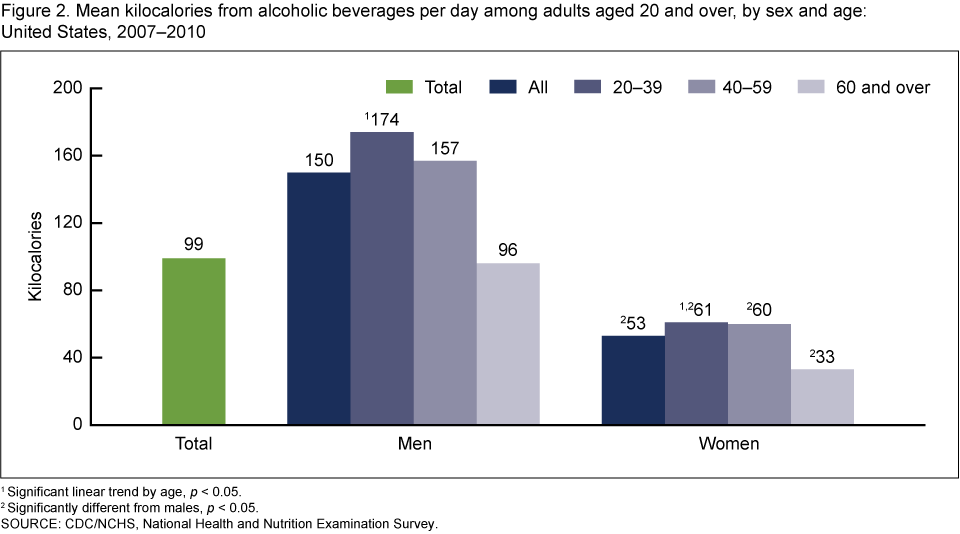
1 Significant linear trend by age, p < 0.05.
2 Significantly different from males, p < 0.05.
SOURCE: CDC/NCHS, National Health and Nutrition Examination Survey.
2 Significantly different from males, p < 0.05.
SOURCE: CDC/NCHS, National Health and Nutrition Examination Survey.
Do the mean calories consumed from alcoholic beverages differ by race and ethnicity?
No significant differences were observed in average calories per day from alcoholic beverages consumed by non-Hispanic white, non-Hispanic black, and Hispanic persons. Non-Hispanic white persons consume an average 105 calories from alcoholic beverages, while non-Hispanic black persons consume 100 calories and Hispanic persons consume 91 calories from alcoholic beverages (Figure 3).Figure 3. Mean kilocalories from alcoholic beverages per day among adults aged 20 and over, by sex and race and ethnicity: United States, 2007–2010

SOURCE: CDC/NCHS, National Health and Nutrition Examination Survey.
Are there differences by poverty level in mean calories consumed from alcoholic beverages?
Average calories from alcoholic beverages are greatest among those in the highest income category. On average, 117 calories per day are consumed from alcoholic beverages by those living at or above 350% of the poverty level, higher than the average of just over 90 calories from alcoholic beverages among those living below 130% of the poverty level. Women living at or above 350% of the poverty level consumed an average 75 calories from alcoholic beverages on a given day, while those living below 130% consumed just over 40 calories. Among men, no differences by income were found in average calories consumed from alcoholic beverages (Figure 4).Figure 4. Mean kilocalories from alcoholic beverages per day among adults aged 20 and over, by sex and poverty level: United States, 2007–2010
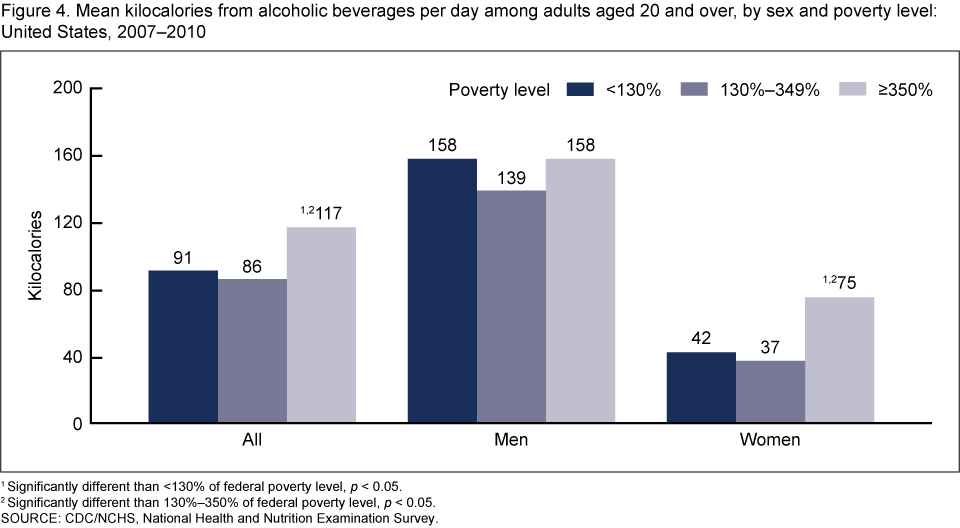
1 Significantly different than <130 em="em" federal="federal" level="level" of="of" poverty="poverty">p
< 0.05.2 Significantly different than 130%–350% of federal poverty level, p < 0.05.
SOURCE: CDC/NCHS, National Health and Nutrition Examination Survey.
What types of alcoholic beverages are contributing the calories that adults consume?
A larger percentage of men than women consume beer; however, a larger percentage of women consume wine on a given day. Almost 20% of men and 5% of women consume beer, while 4% of men and 7% of women consume wine on a given day (not shown). On average, men consume more alcoholic beverage calories per day from beer (103 calories) than from liquor (34 calories) and wine (12 calories). Among women, average calories from beer (18 calories) are equivalent to average calories from liquor (18 calories) and wine (17 calories). In both men and women, average calories from beer decrease with age. Younger men consume on average 128 calories from beer, compared with older men, who consume 48 calories. Similarly, younger women consume on average 24 calories from beer, compared with older women, who consume 6 calories (Figure 5).Figure 5. Mean kilocalories from alcoholic beverages per day among adults aged 20 and over, by sex, age, and type of alcohol: United States, 2007–2010
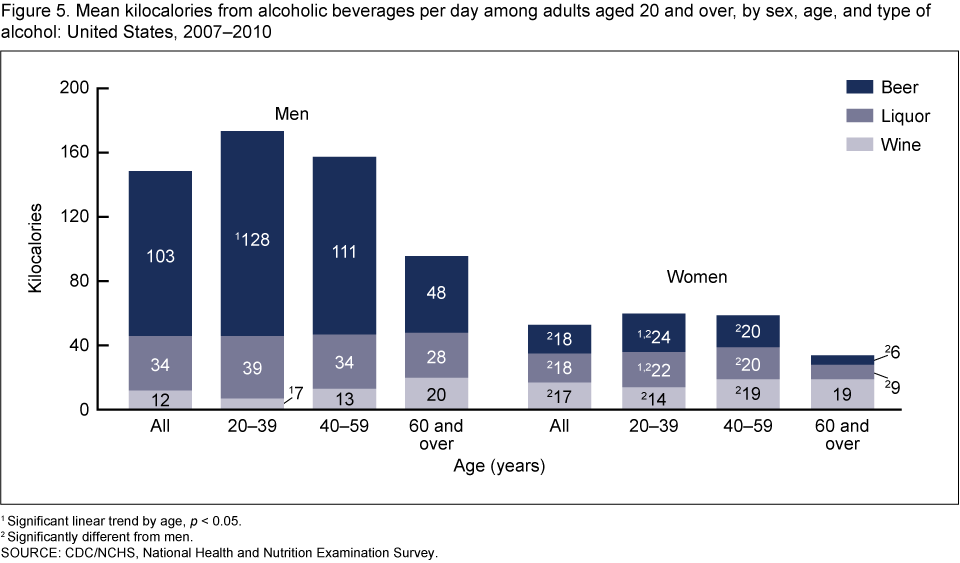
1 Significant linear trend by age, p < 0.05.
2 Significantly different from men.
SOURCE: CDC/NCHS, National Health and Nutrition Examination Survey.
2 Significantly different from men.
SOURCE: CDC/NCHS, National Health and Nutrition Examination Survey.
Summary
On a given day, almost one-third of men and 18% of women aged 20 and over consume alcoholic beverages. On average, men aged 20–39 consume the greatest number of calories—174 per day—from alcoholic beverages compared with other groups. This is greater than the 150 calories in one 12-oz can of soda.On a given day, consumers of alcoholic beverages obtain approximately 16% of their total caloric intake from alcoholic beverages. This represents the same contribution to overall calories as the 16% from added sugars among U.S. children (5). According to the Dietary Guidelines for Americans 2010, for most people, no more than 5%–15% of calories should be from solid fats and added sugars at any calorie intake level (2). Because alcohol is considered part of discretionary solid fats and added sugars, the percentage of total calories from alcohol alone is above the recommended 5%–15% (2).
Beer is the biggest contributor to alcoholic beverage calories among men—103 of the 150 mean calories per day. This represents approximately one beer or one drink. The Dietary Guidelines for Americans 2010 states that if alcohol is consumed, it should be consumed in moderation: one drink per day for women and two drinks per day for men (2). On average across the total population, men and women fall within these guidelines. However, 19% of men consume more than 300 calories from alcoholic beverages on a given day, exceeding two drinks. Among women, 12% consume more than 150 calories from alcoholic beverages on a given day, exceeding one drink.
Definitions
Calorie, kilocalorie: A calorie is a measure of the energy produced as foods or beverages are burned for energy in the body. The term calorie is usually used when discussing energy from foods and diets, but the unit of measure is actually a kilocalorie (6).Alcoholic beverage: Includes beer, wine, liquor, and mixed drinks (cocktails).
Alcoholic beverage calories: Calories consumed from any alcoholic beverage reported from in-person 24-hour dietary recall interviews.
Consumers of alcoholic beverages: Any adult aged 20 or over who reported consuming more than zero calories from an alcoholic beverage (see definition) on a given day, specifically the 24-hour period prior to the dietary recall interview (midnight to midnight).
One drink: The equivalent of 12 oz of beer (approximately 150 calories), or 5 oz of wine (approximately 120 calories), or 1.5 oz of liquor (approximately 100 calories) (2,4).
Percent of federal poverty level: An index based on the ratio of family income to poverty. The U.S. Department of Health and Human Services' poverty guidelines were used as the poverty measure to calculate this index (7). These guidelines are issued each year in the Federal Register for determining financial eligibility for certain federal programs such as Head Start; Supplemental Nutrition Assistance Program, or SNAP (formerly the Food Stamp Program); Special Supplemental Nutrition Program for Women, Infants, and Children, or WIC; and the National School Lunch Program.
Data sources and methods
National Health and Nutrition Examination Survey (NHANES) data for 2007–2010 were used for these analyses. NHANES is conducted by the Centers for Disease Control and Prevention's National Center for Health Statistics to assess the health and nutritional status of the civilian noninstitutionalized U.S. population. The survey combines an in-home interview and a standardized physical examination at a mobile examination center (MEC). The data for this report were collected via an in-person 24-hour dietary recall interview in the MEC. Dietary recalls cover intake during the day (24 hours) prior to the standardized physical examination at the MEC (8).The sample design includes oversampling to obtain reliable estimates of health and nutritional measures for population subgroups. For 2007–2010, the Hispanic population was oversampled. Data were analyzed using sample weights to account for differential probabilities of selection, nonresponse, and noncoverage. The standard errors of the percentages were estimated using Taylor series linearization, a method that incorporates the sample weights and sample design.
Differences between groups were evaluated using a t statistic at the p < 0.05 significance level. Tests for linear trends by age and income were set at the p < 0.05 significance level. All differences reported are statistically significant unless otherwise indicated. Statistical analyses were conducted using SAS version 9.2 (SAS Institute Inc., Cary, N.C.) and SUDAAN version 10.0 (RTI International, Research Triangle Park, N.C.).
About the authors
Samara Joy Nielsen, Brian K. Kit, and Cynthia L. Ogden are with the Centers for Disease Control and Prevention's (CDC) National Center for Health Statistics (NCHS), Division of Health and Nutrition Examination Surveys.Tala H.I. Fakhouri is with the Epidemic Intelligence Service, Office of Surveillance, Epidemiology, and Laboratory Services, and the Analysis Branch, Division of Health and Nutrition Examination Surveys, NCHS, CDC, Atlanta, GA.
References
- Alcohol-related disease impact (ARDI) software. Atlanta, GA: Centers for Disease Control and Prevention. 2008.
- U.S. Department of Agriculture, U.S. Department of Health and Human Services. Dietary Guidelines for Americans 2010. 7th ed. Washington, DC: U.S. Government Printing Office. 2010.
- Ogden CL, Kit BK, Carroll MD, Park S. Consumption of sugar drinks in the United States, 2005–2008
- U.S. Department of Agriculture, Agricultural Research Service, National Agricultural Library. National nutrient database for standard reference, release 25
. Beltsville, MD: Beltsville Human Nutrition Research Center, Food Surveys Research Group
- Ervin RB, Kit BK, Carroll MD, Ogden CL. Consumption of added sugar among U.S. children and adolescents, 2005–2008
- Krause MV, Mahan LK. Energy. In: Food, nutrition, and diet therapy: A textbook of nutritional care. 7th ed. Philadelphia, PA: W.B. Saunders Company; p. 9–23. 1984.
- U.S. Department of Health and Human Services. Poverty guidelines, research, and measurement
- National Center for Health Statistics. National Health and Nutrition Examination Survey: Questionnaires, datasets, and related documentation.
Suggested citation
Nielsen SJ, Kit BK, Fakhouri T, Ogden CL. Calories consumed from alcoholic beverages by U.S. adults, 2007–2010. NCHS data brief, no 110. Hyattsville, MD: National Center for Health Statistics. 2012.Copyright information
All material appearing in this report is in the public domain and may be reproduced or copied without permission; citation as to source, however, is appreciated.National Center for Health Statistics
Edward J. Sondik, Ph.D., DirectorJennifer H. Madans, Ph.D., Associate Director for Science


.png)


No hay comentarios:
Publicar un comentario