NCHS Data Brief
Number 134, November 2013
Dementia Special Care Units in Residential Care Communities: United States, 2010
On This Page
- Key findings
- Seventeen percent of residential care communities had dementia special care units.
- Residential care communities with dementia special care units had special features for the care of residents with dementia.
- Residential care communities with dementia special care units differed from those without in size, chain affiliation, Medicaid participation, and whether the community was built as a residential care community.
- Residential care communities with dementia special care units differed from those without in geographical location.
- Summary
- Definitions
- Data source and methods
- About the authors
- References
- Suggested citation
 (397 KB)
Eunice Park-Lee, Manisha Sengupta, and Lauren D. Harris-Kojetin
Key findings
- In 2010, 17% of residential care communities had dementia special care units.
- Beds in dementia special care units accounted for 13% of all residential care beds.
- Residential care communities with dementia special care units were more likely than those without to have more beds, be chain-affiliated, and be purposely built as a residential care community, and less likely to be certified or registered to participate in Medicaid.
- Residential care communities with dementia special care units were more likely than those without to be located in the Northeast and in a metropolitan statistical area, and less likely to be in the West.
Keywords: dementia care, assisted living, long-term care, National Survey of Residential Care Facilities
Seventeen percent of residential care communities had dementia special care units.
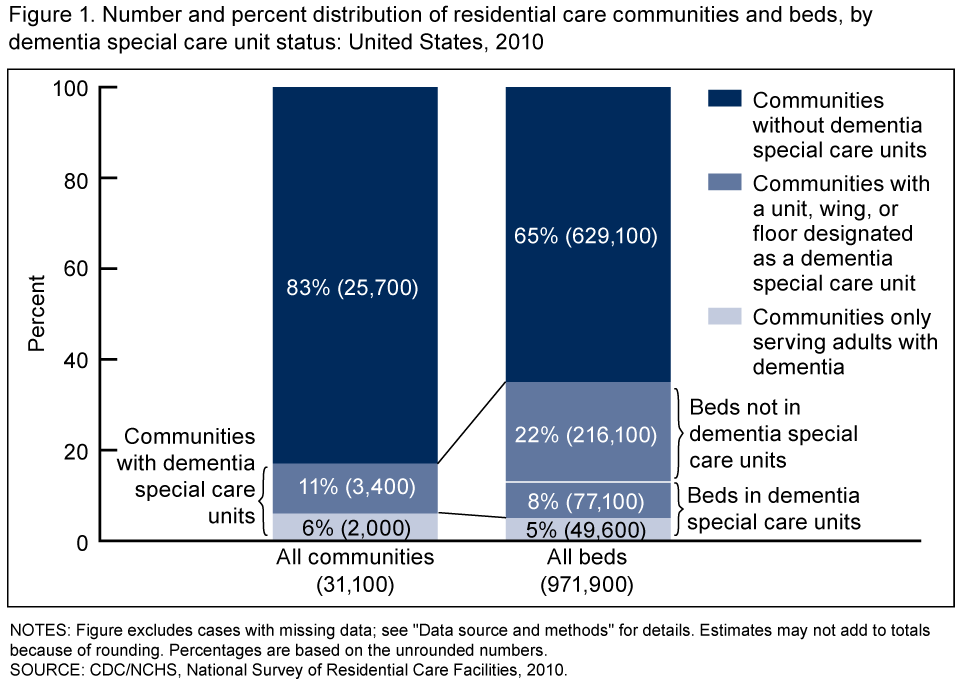
Figure 1. Number and percent distribution of residential care communities and beds, by dementia special care unit status: United States, 2010
NOTES: Figure excludes cases with missing data; see "Data source and methods" for details. Estimates may not add to totals because of rounding. Percentages are based on the unrounded numbers.
SOURCE: CDC/NCHS, National Survey of Residential Care Facilities, 2010.
SOURCE: CDC/NCHS, National Survey of Residential Care Facilities, 2010.
- Approximately 6% of residential care communities only served adults with Alzheimer’s disease or other dementia. Residential care communities that only served adults with dementia accounted for 36% of residential care communities with dementia special care units (Figure 1).
- About 11% of residential care communities had a distinct unit, wing, or floor designated as a dementia special care unit within the larger residential care community. Residential care communities with a distinct dementia special care unit within the larger community accounted for 64% of residential care communities with dementia special care units.
- Beds in dementia special care units accounted for 13% of all residential care beds.
- About one-quarter (26%) of the beds in communities with a distinct unit, wing, or floor designated as a dementia special care unit within the larger residential care community were in dementia special care units.
Residential care communities with dementia special care units had special features for the care of residents with dementia.
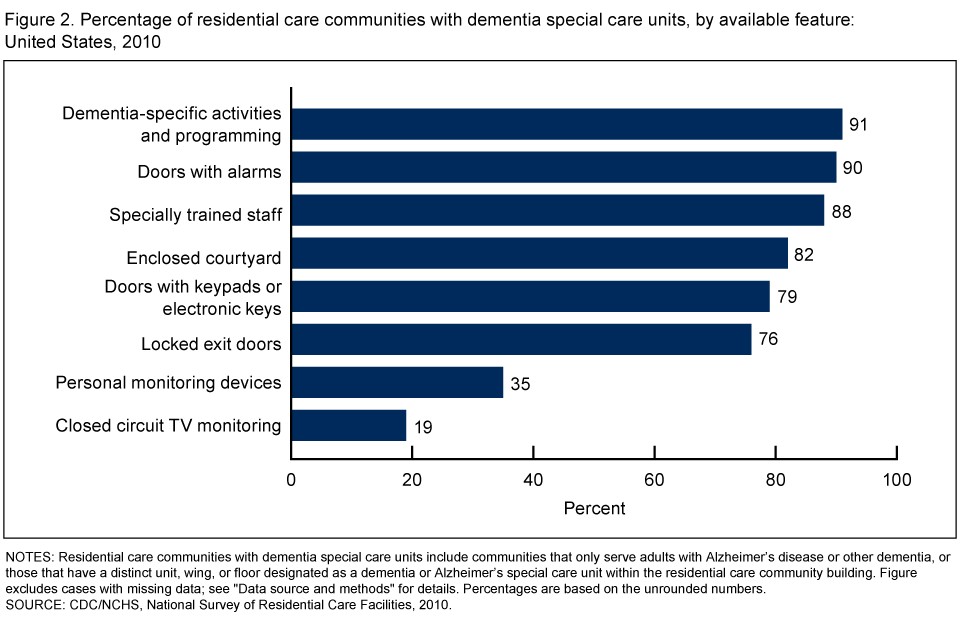
- Almost all dementia special care units offered dementia-specific activities and programming (91%) and had doors with alarms (90%) (Figure 2).
- At least 7 out of 10 residential care communities with dementia special care units had features such as specially trained staff (88%), an enclosed courtyard (82%), doors with keypads or electronic keys (79%), and locked exit doors (76%).
- Less commonly available features in dementia special care units were personal monitoring devices (35%) and closed circuit TV monitoring (19%).
Figure 2. Percentage of residential care communities with dementia special care units, by available feature: United States, 2010
NOTES: Residential care communities with dementia special care units include communities that only serve adults with Alzheimer’s disease or other dementia, or those that have a distinct unit, wing, or floor designated as a dementia or Alzheimer’s special care unit within the residential care community building. Figure excludes cases with missing data; see "Data source and methods" for details. Percentages are based on the unrounded numbers.
SOURCE: CDC/NCHS, National Survey of Residential Care Facilities, 2010.
SOURCE: CDC/NCHS, National Survey of Residential Care Facilities, 2010.
Residential care communities with dementia special care units differed from those without in size, chain affiliation, Medicaid participation, and whether the community was built as a residential care community.
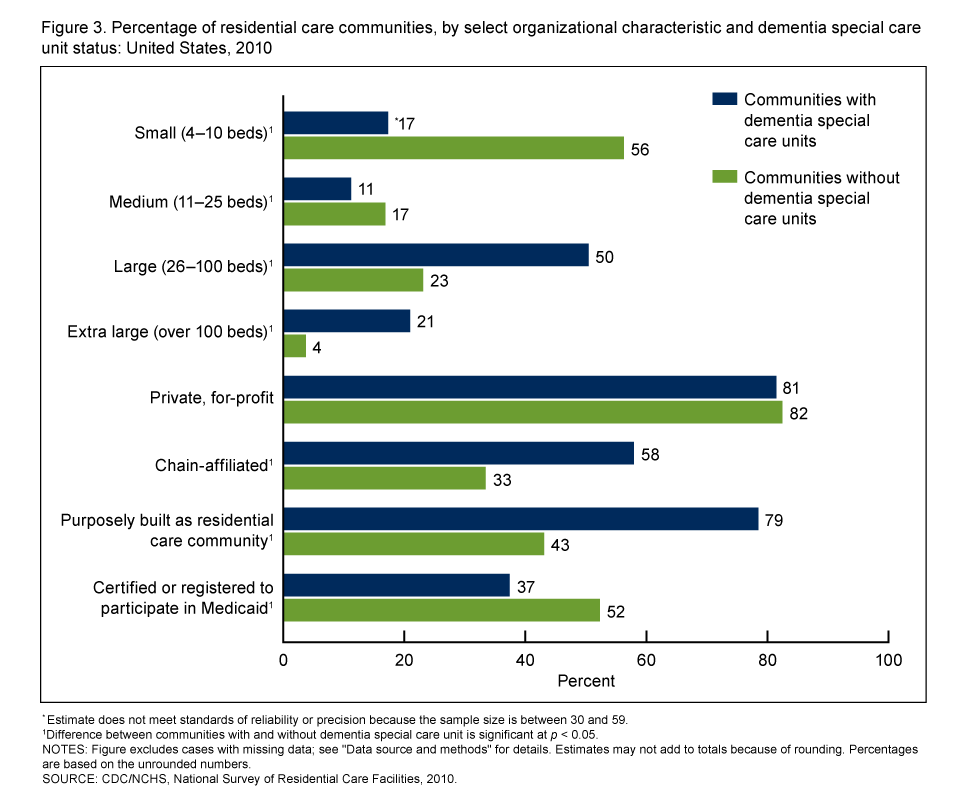
- Seven out of 10 residential care communities with dementia special care units were large communities with 26–100 beds (50%) or extra large communities with over 100 beds (21%), while 56% of communities without dementia special care units were small communities with 4–10 beds (Figure 3).
- Over one-half of communities with dementia special care units were chain-affiliated (58%) and purposely built as a residential care community (79%) compared with 33% and 43% of communities without dementia special care units, respectively.
- Communities with dementia special care units were less likely to be certified or registered to participate in Medicaid (37%) than those without dementia special care units (52%).
- Similar proportions of communities with and without dementia special care units were private, for-profit communities (81% compared with 82%).
Figure 3. Percentage of residential care communities, by select organizational characteristic and dementia special care unit status: United States, 2010
* Estimate does not meet standards of reliability or precision because the sample size is between 30 and 59.
1Difference between communities with and without dementia special care unit is significant at p < 0.05.
NOTES: Figure excludes cases with missing data; see "Data source and methods" for details. Estimates may not add to totals because of rounding. Percentages are based on the unrounded numbers.
SOURCE: CDC/NCHS, National Survey of Residential Care Facilities, 2010.
Residential care communities with dementia special care units differed from those without in geographical location.
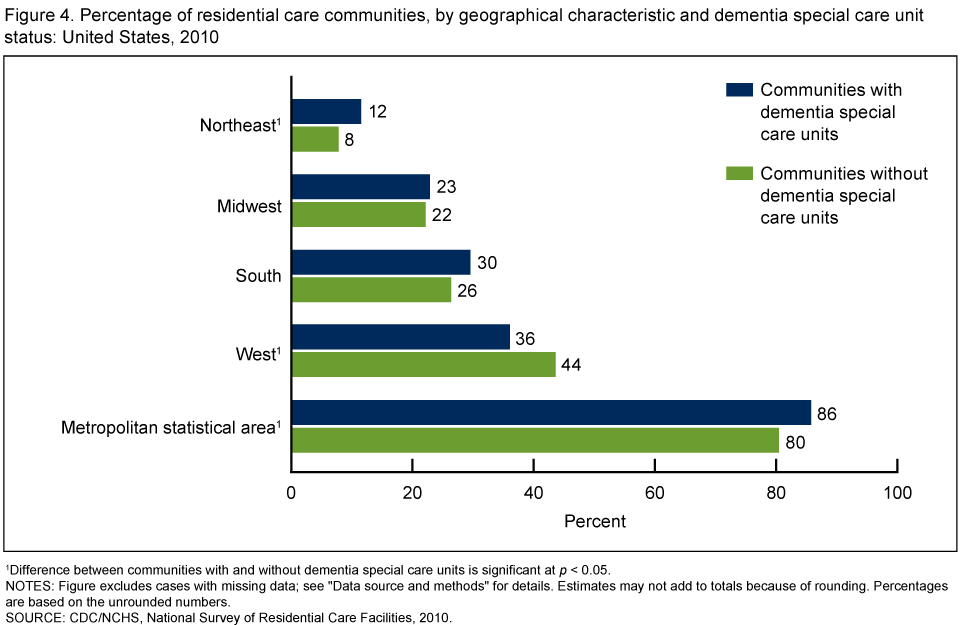
- Communities with dementia special care units were more likely than those without dementia special care units to be located in the Northeast (12% compared with 8%), and less likely to be in the West (36% compared with 44%) (Figure 4).
- Communities with dementia special care units were more likely to be in a metropolitan statistical area (MSA) (86%) than those without dementia special care units (80%).
Figure 4. Percentage of residential care communities, by geographical characteristic and dementia special care unit status: United States, 2010
1Difference between communities with and without dementia special care units is significant at p < 0.05.
NOTES: Figure excludes cases with missing data; see "Data source and methods" for details. Estimates may not add to totals because of rounding. Percentages are based on the unrounded numbers.
SOURCE: CDC/NCHS, National Survey of Residential Care Facilities, 2010.
NOTES: Figure excludes cases with missing data; see "Data source and methods" for details. Estimates may not add to totals because of rounding. Percentages are based on the unrounded numbers.
SOURCE: CDC/NCHS, National Survey of Residential Care Facilities, 2010.
Summary
In 2010, almost 2 out of 10 residential care communities had dementia special care units. Beds in dementia special care units represented 13% of all residential care beds. At least 90% of residential care communities with dementia special care units had dementia-specific activities and programming, while only 19% had closed circuit TV monitoring. When organizational characteristics were compared, communities with dementia special care units were more likely than those without dementia special care units to be large (26–100 beds) and extra large communities (over 100 beds), while communities without dementia special care units were more likely to be smaller communities with 4–25 beds. Communities with dementia special care units were more likely than those without dementia special care units to be chain-affiliated and purposely built as a residential care community, and less likely to be certified or registered to participate in Medicaid. In addition, communities with dementia special care units were more likely than those without dementia special care units to be located in the Northeast and in an MSA, and less likely to be in the West.Definitions
Dementia special care units: A distinct unit, wing, or floor designated as a dementia or Alzheimer’s special care unit within the residential care community, or residential care communities that only serve adults with Alzheimer’s disease or other dementia.Residential care communities: Include assisted living facilities and similar residential care communities (e.g., personal care homes, adult care homes, board care homes, adult foster care) that meet the study eligibility criteria provided in “Data source and methods.”
Residential care communities with dementia special care units: Refer to communities that only serve adults with Alzheimer’s disease or other dementia, or those that have a distinct unit, wing, or floor designated as a dementia or Alzheimer’s special care unit within the residential care community building.
Residential care bed: Refers to licensed, registered, or certified residential care beds.
Size: Based on the number of licensed, registered, or certified residential care beds (both occupied and unoccupied) in a residential care community: small (4–10 beds), medium (11–25 beds), large (26–100 beds), and extra large (more than 100 beds).
Ownership type: Categorized by two types: (a) private, for-profit, and (b) other, which includes private nonprofit and state, county, or local government ownership. The private, for-profit category includes publicly traded facilities.
Chain affiliation: Describes communities owned by a chain, group, or multicommunity system. A chain is more than one community under common ownership or management, and may include communities within a state or across multiple states.
Region: Created by grouping conterminous states into geographic areas corresponding to groups used by the U.S. Census Bureau. The U.S. Census Bureau’s Website
 provides a listing of states included in each of the four U.S. Census regions.
Metropolitan statistical area (MSA): Designates a county or group of contiguous counties that contains at least one urbanized area of 50,000 or more population. An MSA may contain other counties that are economically and socially integrated with the central county, as measured by commuting.
Data source and methods
Facility data of the 2010 National Survey of Residential Care Facilities (NSRCF), conducted by the Centers for Disease Control and Prevention’s (CDC) National Center for Health Statistics (NCHS), Division of Health Care Statistics, were used for these analyses. To be eligible for the study, residential care communities must be licensed, registered, listed, certified, or otherwise regulated by the state to provide room and board with at least two meals a day, around-the-clock onsite supervision, and help with personal care such as bathing and dressing or health-related services such as medication management; have four or more licensed, certified, or registered beds; and have at least one resident currently living in the community. These communities serve a predominantly adult population. Communities licensed to serve the mentally ill or the developmentally disabled populations exclusively are excluded. Nursing homes are also excluded unless they have a unit or wing meeting the above definition and residents can be separately enumerated.The 2010 NSRCF used a stratified two-stage probability sampling design. The first stage was the selection of residential care communities from the sampling frame representing the universe of residential care communities. The second stage was the selection of current residents. For the 2010 NSRCF, 3,605 residential care communities were sampled with probability proportional to size. Interviews were completed with 2,302 communities, for a first-stage community unweighted response rate of 79% and a weighted response rate (for differential probabilities of selection) of 81%. More details about sampling design and data collection are available elsewhere (4).
Differences between communities with dementia special care units and those without dementia special care units were evaluated using chi-square and t tests. All significance tests were two-sided using p < 0.05 as the level of significance. The difference between any two estimates is mentioned in the text only if it is statistically significant. Data analyses were performed using the SAS-callable SUDAAN (5). Cases with missing data were excluded from the analyses on a variable-by-variable basis. Variables used in this report had a weighted percentage of cases with missing data between 0.11% (n = 1) and 0.35% (n = 13). Because estimates were rounded, individual estimates may not sum to totals. Percentages are based on the unrounded numbers.
About the authors
Eunice Park-Lee, Manisha Sengupta, and Lauren D. Harris-Kojetin are with CDC’s NCHS, Division of Health Care Statistics.References
- Caffrey C, Sengupta M, Park-Lee E, et al. Residents living in residential care facilities: United States, 2010. NCHS data brief, no 91. Hyattsville, MD: National Center for Health Statistics. 2012.
- Hyde J, Perez R, Forester B. Dementia and assisted living. Gerontologist 47 Spec No 3:51–67. 2007.
- National Center for Assisted Living. Assisted living state regulatory review 2012
- Moss AJ, Harris-Kojetin LD, Sengupta M, et al. Design and operation of the 2010 National Survey of Residential Care Facilities. National Center for Health Statistics. Vital Health Stat 1(54). 2011.
- RTI International. SUDAAN (Release 11.0.0) [computer software]. 2012.
Suggested citation
Park-Lee E, Sengupta M, Harris-Kojetin LD. Dementia special care units in residential care communities: United States, 2010. NCHS data brief, no 134. Hyattsville, MD: National Center for Health Statistics. 2013.Copyright information
All material appearing in this report is in the public domain and may be reproduced or copied without permission; citation as to source, however, is appreciated.National Center for Health Statistics
Charles J. Rothwell, M.S., Acting DirectorJennifer H. Madans, Ph.D., Associate Director for Science
Division of Health Care Statistics
Clarice Brown, M.S., Director


.png)


No hay comentarios:
Publicar un comentario