Home Births in the United States, 1990–2009
On This Page
- Key findings
- U.S. home births increased by 29% from 2004 to 2009.
- In 2009, about 1 in 90 births to non-Hispanic white women were home births.
- The percentage of home births was generally higher in the northwestern and lower in the southeastern United States.
- Most home births are attended by midwives.
- Compared with hospital births, home births are more common among older married women with several previous children.
- Home births have a lower risk profile than hospital births.
- Summary
- Definitions
- Data source and methods
- About the authors
- References
- Suggested citation
 (897 KB)
Marian F. MacDorman, Ph.D.; T.J. Mathews, M.S.; and Eugene Declercq, Ph.D.
Key findings
- After a decline from 1990 to 2004, the percentage of U.S. births that occurred at home increased by 29%, from 0.56% of births in 2004 to 0.72% in 2009.
- For non-Hispanic white women, home births increased by 36%, from 0.80% in 2004 to 1.09% in 2009. About 1 in every 90 births for non-Hispanic white women is now a home birth. Home births are less common among women of other racial or ethnic groups.
- Home births are more common among women aged 35 and over, and among women with several previous children.
- Home births have a lower risk profile than hospital births, with fewer births to teenagers or unmarried women, and with fewer preterm, low birthweight, and multiple births.
- The percentage of home births in 2009 varied from a low of 0.2% of births in Louisiana and the District of Columbia, to a high of 2.0% in Oregon and 2.6% in Montana.
Keywords: birth certificates, out-of-hospital birth
full-text:
Products - Data Briefs - Number 84 - January 2012
U.S. home births increased by 29% from 2004 to 2009.
The percentage of all U.S. births that occurred at home increased from 0.56% in 2004 to 0.72% in 2009 (Figure 1).
NOTE: Numbers of home births are shown in parentheses after percentages.
SOURCE: CDC/NCHS, birth certificate data from the National Vital Statistics System.
In 2009, there were 29,650 home births in the United States (representing 0.72% of births), the highest level since data on this item began to be collected in 1989.
Previously, the percentage of home births had declined slowly from 0.67% of all U.S. births in 1990 to 0.56% in 2004.
In 2009, about 1 in 90 births to non-Hispanic white women were home births.
There are large differences in the percentage of home births by maternal race and ethnicity, and these differences have widened over time (Figure 2).In 2009, the percentage of home births was three to five times higher for non-Hispanic white women than for any other racial or ethnic group.
The percentage of home births to non-Hispanic white women increased by 14% from 1990 to 2004 and, more rapidly, by 36% from 2004 to 2009 (from 0.80% to 1.09%).
In contrast, from 1990 to 2004, the percentage of home births declined for American Indian or Alaska Native (AIAN), Asian or Pacific Islander (API), Hispanic, and non-Hispanic black women. From 2004 to 2009, the percentage of home births increased for API and Hispanic women, and remained about the same for non-Hispanic black and AIAN women.
About 90% of the total increase in home births from 2004 to 2009 was due to the increase among non-Hispanic white women.
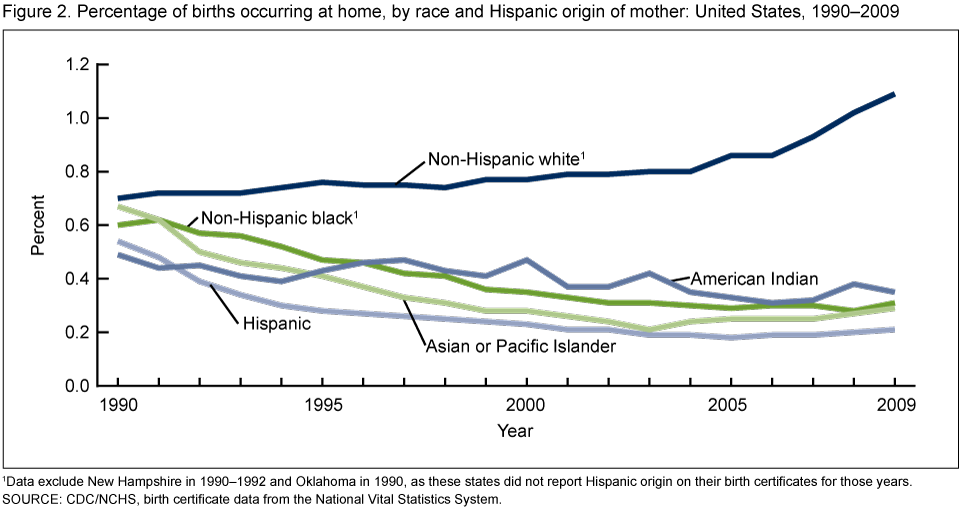
1Data exclude New Hampshire in 1990–1992 and Oklahoma in 1990, as these states did not report Hispanic origin on their birth certificates for those years.
SOURCE: CDC/NCHS, birth certificate data from the National Vital Statistics System.
The percentage of home births was generally higher in the northwestern and lower in the southeastern United States.
In 2009, Montana had the highest percentage of home births (2.55%), followed by Oregon (1.96%) and Vermont (1.91%). Five additional states (Idaho, Pennsylvania, Utah, Washington, and Wisconsin) had a percentage of home births of 1.50% or above (Figure 3).In contrast, the percentage of home births was less than 0.50% for southeastern states from Texas to North Carolina, as well as for Connecticut, Delaware, the District of Columbia, Illinois, Massachusetts, Nebraska, New Jersey, Rhode Island, South Dakota, and West Virginia.
The increase in the percentage of home births from 2004 to 2009 was widespread and involved selected states from every region of the country. Overall, 31 states had statistically significant increases, and only two areas had statistically significant declines (see Figure 3 and associated data table
[PDF - 133 KB]). 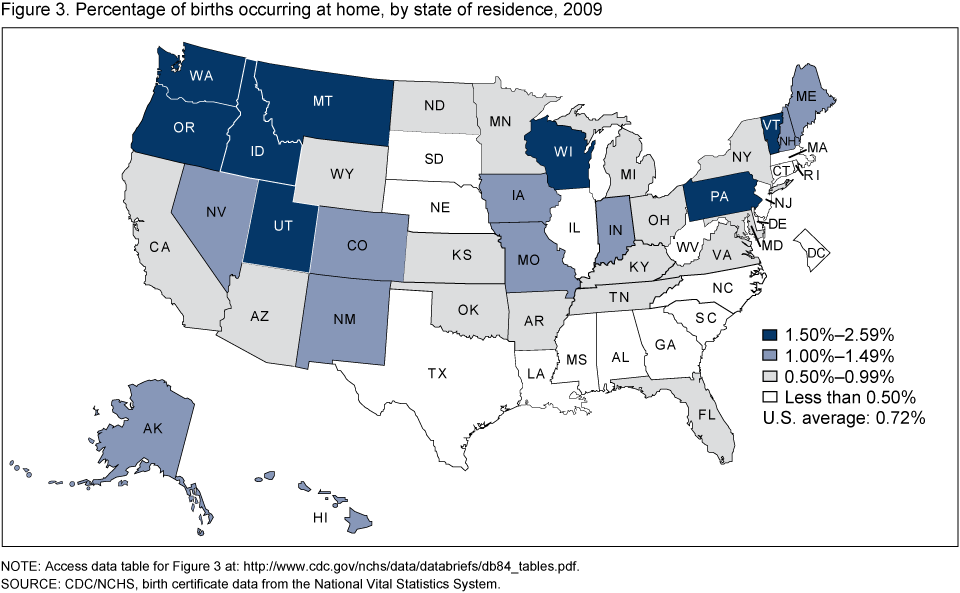
NOTE: Access data table for Figure 3
[PDF - 133 KB].SOURCE: CDC/NCHS, birth certificate data from the National Vital Statistics System.
Most home births are attended by midwives.
In 2009, 62% of home births were attended by midwives: 19% by certified nurse midwives and 43% by other midwives (such as certified professional midwives or direct-entry midwives). Among hospital births, only 7% were attended by midwives (Figure 4).Only 5% of home births were attended by physicians, and a previous study suggested that many of these were unplanned home births (possibly involving emergency situations) (6). For hospital births, 92% were attended by physicians.
For home births, 33% were reported as delivered by "other" attendants. "Other" may include, for example, a family member or emergency medical technician (3,7). Among hospital births, less than 1% of births had "other" attendants.
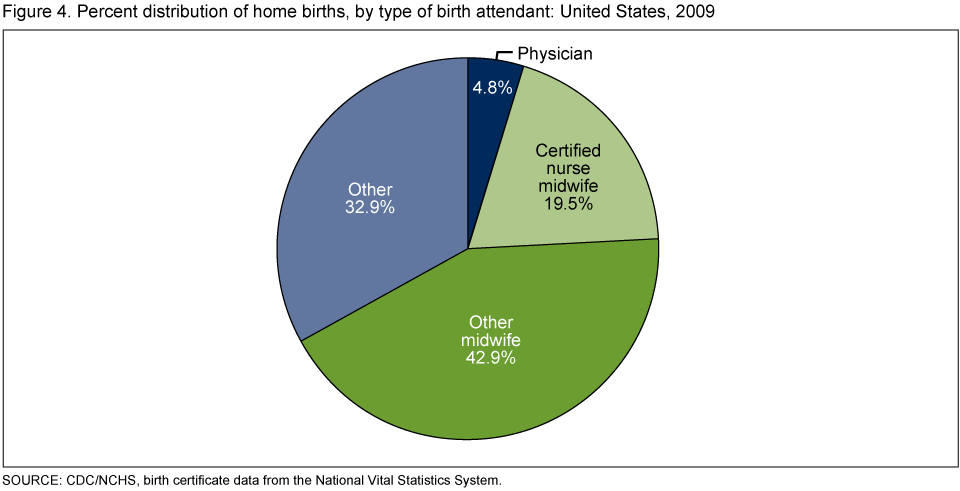
SOURCE: CDC/NCHS, birth certificate data from the National Vital Statistics System.
Compared with hospital births, home births are more common among older married women with several previous children.
One in five home births were to women aged 35 and over, compared with 14% of hospital births (Figure 5).About one-half of home births were third- or higher-order births, compared with 28% of hospital births.
About 84% of home births were to married women, compared with 59% of hospital births.

SOURCE: CDC/NCHS, birth certificate data from the National Vital Statistics System.
Home births have a lower risk profile than hospital births.
The percentage of home births that were preterm was 6%, compared with 12% for hospital births (Figure 6).The percentage of home births that were low birthweight was 4%, compared with 8% for hospital births.
Less than 1% of home births were multiple deliveries, compared with 3.5% of hospital births.
The lower risk profile of home births suggests that home birth attendants are selecting low-risk women as candidates for home birth (5).

SOURCE: CDC/NCHS, birth certificate data from the National Vital Statistics System.
Summary
After 14 years of decline, the percentage of home births rose by 29% from 2004 to 2009, to the point where it is at the highest level since data on this item began to be collected in 1989. The overall increase in home births was driven mostly by a 36% increase for non-Hispanic white women. About 1 out of every 90 births to non-Hispanic white women are now home births. The percentage of home births for non-Hispanic white women was three to five times higher than for any other racial or ethnic group.Home births have a lower risk profile than hospital births, with fewer births to teenagers or unmarried women, and with fewer preterm, low birthweight, and multiple births. The lower risk profile of home compared with hospital births suggests that home birth attendants are selecting low-risk women as candidates for home birth.
The increase in the percentage of home births from 2004 to 2009 was widespread and involved selected states from every region of the country. The large variations in the percentage of home births by state may be influenced by differences among states in laws pertaining to midwifery practice or out-of-hospital birth (8,9), as well as by differences in the racial and ethnic composition of state populations, as home births are more prevalent among non-Hispanic white women (7).
Studies have suggested that most home births are intentional or planned home births, whereas others are unintentional or unplanned, because of an emergency situation (i.e., precipitous labor, labor complications, or unable to get to the hospital in time) (3,6). Although not representative of all U.S. births (see "Data source and methods"), 87% of home births in a 26-state reporting area (comprising 50% of U.S. births) were planned in 2009. For non-Hispanic white women, 93% of home births were planned (10).
Women may prefer a home birth over a hospital birth for a variety of reasons, including a desire for a low-intervention birth in a familiar environment surrounded by family and friends, and cultural or religious concerns (9,11). Lack of transportation in rural areas and cost factors may also play a role, as home births cost about one-third as much as hospital births (9,11,12).
Definitions
Home birth: A birth that takes place in a residence (home).Percentage of home births: The number of home births divided by the total number of births (regardless of place of delivery) times 100.
Preterm birth: Birth before 37 completed weeks of gestation.
Low birthweight: Infant weighing less than 2,500 grams at birth.
Data source and methods
This report is based on data from the National Vital Statistics System, Natality Data Files for 1990–2009. The Natality Data Files include data for all births occurring in the United States, and include information on a wide range of maternal and infant demographic and health characteristics (4). These data files are available for download at Vital Statistics Online and data may also be accessed through the interactive data tool, VitalStats.Data on home birth began to be reported with the 1989 revision of the U.S. Standard Certificate of Live Birth. Prior to 1989, births were reported as occurring in or out of the hospital, with no specific category for home births.
The 2003 revision of the U.S. Standard Certificate of Live Birth added a data item on planning status of home birth. However, due to the staggered implementation of the 2003 revision among states, only 26 states (comprising 50% of U.S. births) reported data on planning status of home birth in 2009 (10). The 26-state area is not representative of the overall U.S. population because it is not a random sample of U.S. births.
About the authors
Marian F. MacDorman and T.J. Mathews are with the Centers for Disease Control and Prevention's National Center for Health Statistics, Division of Vital Statistics, Reproductive Statistics Branch. Eugene Declercq is Professor, Department of Community Health Sciences, Boston University School of Public Health.References
- Wertz RW, Wertz DC. Lying-in: A history of childbirth in America. New York: Schocken Books. 1977.
- Curtin SC, Park MM. Trends in the attendant, place, and timing of births, and in the use of obstetric interventions: United States, 1989–97. National vital statistics reports; vol 47 no 27. Hyattsville, MD: National Center for Health Statistics. 1999.
- MacDorman MF, Menacker F, Declercq E. Trends and characteristics of home and other out-of-hospital births in the United States, 1990–2006. National vital statistics reports; vol 58 no 11. Hyattsville, MD: National Center for Health Statistics. 2010.
- Martin JA, Hamilton BE, Ventura SJ, et al. Births: Final data for 2009. National vital statistics reports; vol 60 no 1. Hyattsville, MD: National Center for Health Statistics. 2011.
- MacDorman MF, Declercq E, Mathews TJ. United States home births increase 20% from 2004 to 2008. Birth 38(3):185–90. 2011.
- Declercq E, MacDorman MF, Menacker F, Stotland N. Characteristics of planned and unplanned home births in 19 states. Obstet Gynecol 116(1):93–9. 2010.
- MacDorman MF, Declercq E, Menacker F. Trends and characteristics of home births in the United States by race and ethnicity, 1990–2006. Birth 38(1):17–23. 2011.
- Midwives Alliance of North America. Direct-entry midwifery state-by-state legal status
.
- Declercq ER, Stotland N. Home birth. In: UpToDate, Rose BD (Ed). Waltham, MA: UpToDate. 2009.
- National Center for Health Statistics. VitalStats. Birth data for 2009.
- Boucher D, Bennett C, McFarlin B, Freeze R. Staying home to give birth: Why women in the United States choose home birth. J Midwifery Womens Health 54(2):119–26. 2009.
- Health Management Associates. Midwifery licensure and discipline program in Washington State: Economic costs and benefits. 2007.
Suggested citation
MacDorman MF, Mathews TJ, Declercq E. Home births in the United States, 1990–2009. NCHS data brief, no 84. Hyattsville, MD: National Center for Health Statistics. 2012.Copyright information
All material appearing in this report is in the public domain and may be reproduced or copied without permission; citation as to source, however, is appreciated.National Center for Health Statistics
Edward J. Sondik, Ph.D., DirectorJennifer H. Madans, Ph.D., Associate Director for Science
Division of Vital Statistics
Charles J. Rothwell, M.S., DirectorMORE:


.png)

.png)


No hay comentarios:
Publicar un comentario