NCHS Data Brief
Number 72, August 2011
Blood Pressure Measurements at Emergency Department Visits by Adults: United States, 2007–2008
On This Page
- Key findings
- Elevated BP is more common at visits to EDs than at visits to primary care providers.
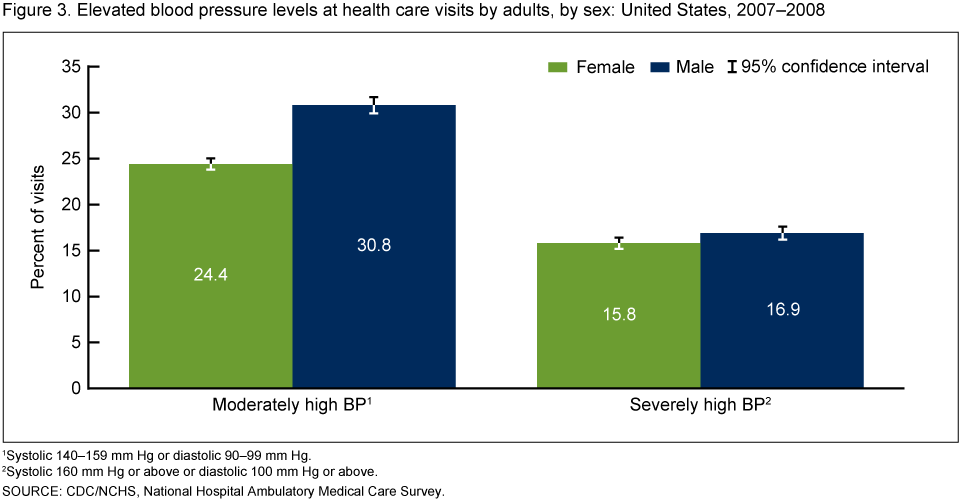
- Elevated BP is more common at ED visits by older patients and men.
- Severely elevated BP is more common at ED visits by non-Hispanic black persons than by non-Hispanic white or Hispanic persons.
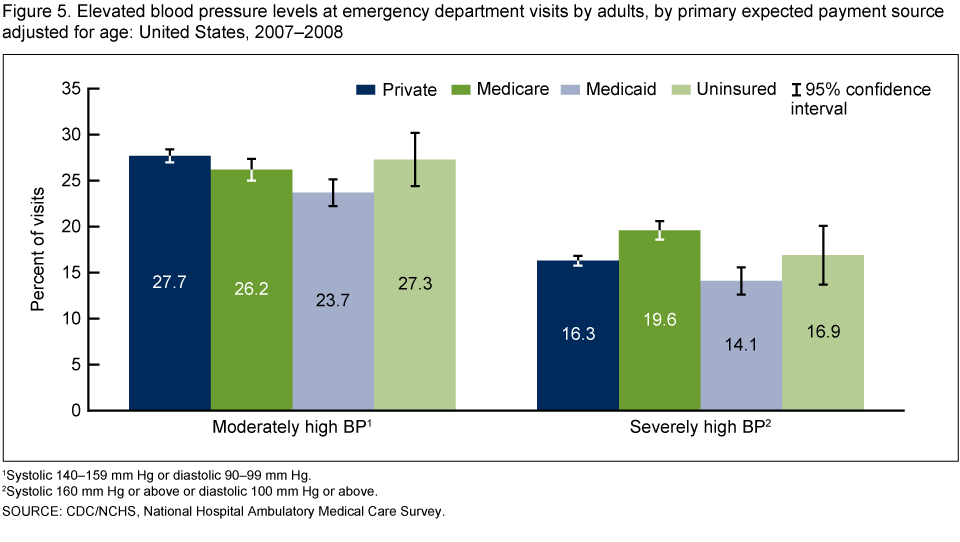
- Elevated BP is more common at ED visits by Medicare beneficiaries and by uninsured patients.
- Summary
- Definitions
- Data sources and methods
- About the author
- References
- Suggested citation
PDF Version
 (695 KB)
Richard W. Niska, M.D., M.P.H., F.A.C.E.P.
Key findings
Data from the National Hospital Ambulatory Medical Care Survey- Blood pressure (BP) is severely elevated at 16.3%, and moderately elevated at 27.2%, of hospital emergency department (ED) visits. Severely and moderately elevated BPs are more common at ED visits than at visits to patients' primary care providers in hospital outpatient departments and physician offices.
- Severely and moderately elevated BPs are more common at ED visits by older age groups and men.
- Severely elevated BP is more common at ED visits by non-Hispanic black persons (19.7%) than by non-Hispanic white (15.3%) or Hispanic (15.3%) persons.
- Severely elevated BP is more common at ED visits by Medicare beneficiaries (19.6%) than by those with private insurance (16.3%) or Medicaid (14.1%). Moderately elevated BP is more common at ED visits by uninsured patients than by privately insured patients or Medicaid beneficiaries.
Keywords: hypertension, disparities, National Hospital Ambulatory Medical Care Survey, National Ambulatory Medical Care Survey
Elevated BP is more common at visits to EDs than at visits to primary care providers.
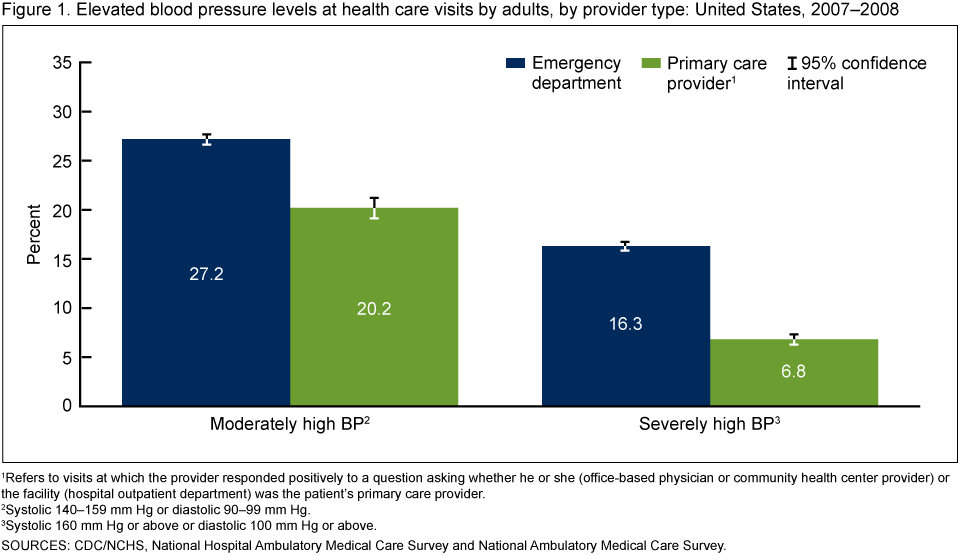
- BP is moderately elevated at 27.2% of ED visits and severely elevated at 16.3% of ED visits. Both prevalence estimates are significantly greater than at visits to patients' primary care providers in hospital outpatient departments (OPDs) and physician offices (Figure 1).
Elevated BP is more common at ED visits by older patients and men.
- The prevalence of severely elevated BP increases significantly for each older age group up to age 65 (Figure 2). There is no significant difference in the prevalence between age groups 65–74 years and 75 years and over.
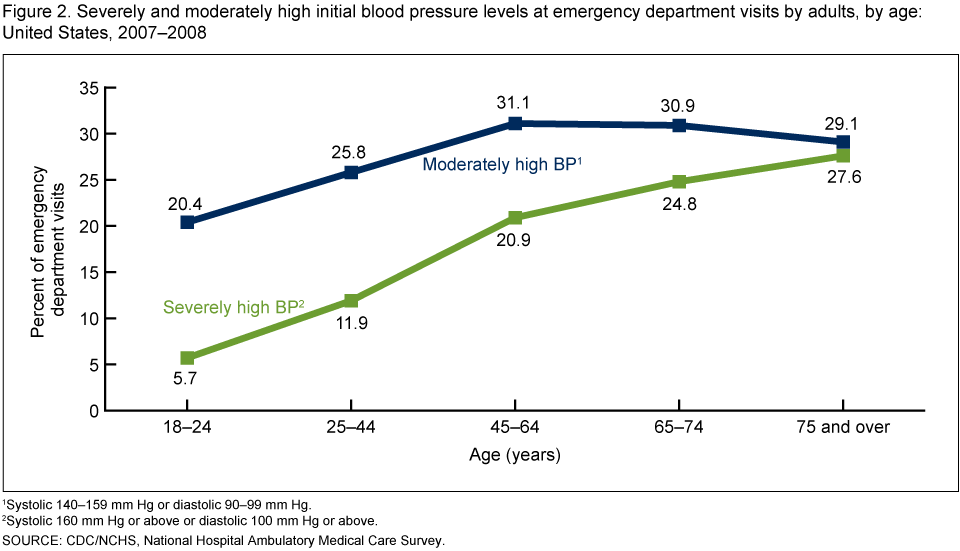
- The prevalence of moderately elevated BP increases significantly for each older age group up to age 45 years. There are no significant differences among age groups 45–64 years, 65–74 years, and 75 years and over.
- The prevalences of both moderately elevated (30.8%) and severely elevated (16.9%) BPs are significantly greater at ED visits by men compared with women (Figure 3).
Severely elevated BP is more common at ED visits by non-Hispanic black persons than by non-Hispanic white or Hispanic persons.
- Compared with non-Hispanic black persons (19.7%), the age-adjusted prevalence of severely elevated BP was significantly less at ED visits by non-Hispanic white (15.3%) and Hispanic (15.3%) persons (Figure 4).
- Compared with non-Hispanic white persons, the age-adjusted prevalence of moderately elevated BP was significantly less at ED visits by Asian persons.

Elevated BP is more common at ED visits by Medicare beneficiaries and by uninsured patients.
- ED visits with Medicare as the primary expected payment source had the highest age-adjusted prevalence of severely elevated BP (19.6%) (Figure 5). The prevalence was significantly less at ED visits by patients with private insurance (16.3%) or Medicaid (14.1%).
- ED visits with Medicaid as the primary expected payment source had the lowest age-adjusted prevalence of moderately elevated BP (23.7%). The prevalence was significantly greater at ED visits by patients with private insurance (27.7%) and the uninsured (27.3%).
Summary
This brief shows that elevated BP readings are much more common at visits to the ED than at visits to outpatient primary care providers. Compared with the 27.0% prevalence found at visits to primary care providers, the combined visit prevalence of severely and moderately elevated BP in EDs is about 43.5%. Disproportionately affected subgroups include patients who are older, male, non-Hispanic black, Medicare beneficiaries, or uninsured.One reason that elevated BP may be observed more frequently in the ED than at visits to primary care providers is that adults in less than optimal general health are more likely to use the ED than those in good health (4). Two national objectives related to prevention of heart disease and stroke are (a) to reduce the proportion of adults with hypertension and (b) to increase the proportion of adults with hypertension whose BP is under control (5). ED visits could provide opportunities to address elevated BP through patient education, initial treatment, and referral to primary care as deemed clinically appropriate.
Definitions
BP levels: The BP abstracted into the ED Patient Record Form is the first BP reading to be recorded in the medical record for that visit. BP measurements were classified hierarchically starting with the more severely elevated measurement, followed by moderately elevated, mildly elevated, and not elevated, based on the criteria of the Seventh Joint National Committee (JNC–7) (3). BP was subdivided into four levels, which are summarized here for completeness. The current analysis concentrated on severely and moderately elevated BPs.- Severely elevated. Systolic 160 mm Hg or above or diastolic 100 mm Hg or above, corresponding to the JNC–7 stage 2 hypertension category.
- Moderately elevated. Systolic 140–159 mm Hg or diastolic 90–99 mm Hg, corresponding to the JNC–7 stage 1 hypertension category.
- Mildly elevated. Systolic 120–139 mm Hg or diastolic 80–89 mm Hg, corresponding to the JNC–7 prehypertension category.
- Not elevated. Systolic less than 120 mm Hg and diastolic less than 80 mm Hg (recorded as P, PALP, DOPP, or DOPPLER, or left blank) (6).
Race and ethnicity: Race and Hispanic ethnicity are abstracted from the ED medical record and converted into a single combined variable that includes non-Hispanic white, non-Hispanic black, Hispanic white or black, Asian, Native Hawaiian or other Pacific Islander, American Indian or Alaska Native, and two or more races. National Hospital Ambulatory Medical Care Survey (NHAMCS) race data were missing for 14.9% of ED visits in 2007 and 16.0% in 2008. Ethnicity data were missing for 24.9% of ED visits in 2007 and 27.7% in 2008. Missing values were imputed for both race and Hispanic ethnicity. In this analysis, visits by Native Hawaiian or other Pacific Islander, American Indian or Alaska Native, and multiracial patients—together accounting for 1.6% of the sample—were not presented because of small sample sizes.
Primary expected payment source: Payment type is abstracted from the ED medical record to include private insurance, Medicare, Medicaid, uninsured (self-pay, no charge, or charity), and other (worker's compensation or other). Dual Medicare-Medicaid beneficiaries were recoded as Medicare. In this analysis, other (4.4%) and unknown (6.4%) payment sources were not presented.
Primary care provider: Visits at which the provider responded positively to a question asking whether he or she (office-based physician or community health center provider) or the facility (OPD) was the patient's primary care provider.
Data sources and methods
All estimates are from the 2007 and 2008 NHAMCS ED visit files and, for comparison, from the NHAMCS OPD and National Ambulatory Medical Care Survey (NAMCS) physician office files. Both NHAMCS and NAMCS are conducted by the Centers for Disease Control and Prevention's (CDC) National Center for Health Statistics (NCHS). NHAMCS is an annual, nationally representative survey of visits to nonfederal general and short-stay hospital EDs and OPDs. NAMCS is an annual, nationally representative survey of visits to nonfederal office-based physicians in the United States. The NAMCS sample contains a separate stratum of community health centers that includes physicians and nonphysician clinicians. More details about NHAMCS and NAMCS methodologies are available elsewhere (7–9).Analyses were restricted to visits by patients aged 18 and over. Estimates for race and ethnicity and for primary payment sources were adjusted for the five age groups defined in this report.
Statistical differences between BP categories and the independent variables were analyzed using SUDAAN 9.1 (10) to account for the multistage sampling design. Significance was defined at the 0.05 level. Determination of statistical significance was based on the two-tailed t test. The Bonferroni procedure was used to establish the critical value for statistically significant differences based on the number of possible comparisons within a particular variable of interest. All differences noted in this report were statistically significant. Differences not mentioned in the text may or may not be statistically significant. Although data for the "other" and "unknown" categories are presented in the figures, these data were not included in the statistical comparisons. To assess the effect of increasing age on the prevalences of severely and moderately elevated BP, a Cochran-Mantel-Haenszel test of trend was performed in SUDAAN 9.1.
About the author
Richard Niska is an emergency physician and epidemiologist with the Centers for Disease Control and Prevention's National Center for Health Statistics, Division of Health Care Statistics.References
- Egan BM, Zhao Y, Axon RN. U.S. trends in prevalence, awareness, treatment, and control of hypertension, 1988–2008. JAMA 303(20):2043–50. 2010.
- Decker WW, Godwin SA, Hess EP, Lenamond CC, Jagoda AS; American College of Emergency Physicians Clinical Policies Subcommittee (Writing Committee) on Asymptomatic Hypertension in the ED. Clinical policy: Critical issues in the evaluation and management of adult patients with asymptomatic hypertension in the emergency department. Ann Emerg Med 47(3):237–49. 2006.
- Chobanian AV, Bakris GL, Black HR, Cushman WC, Green LA , Izzo JL Jr, et al. Seventh report of the Joint National Committee on Prevention, Detection, Evaluation, and Treatment of High Blood Pressure. Hypertension. 42(6):1206–52. 2003.
- Garcia TC, Bernstein AB, Bush MA.Emergency department visitors and visits: Who used the emergency room in 2007? NCHS data brief, no 38.
- U.S. Department of Health and Human Services. Healthy People 2020 topics and objectives: Heart disease and stroke. HDS–5.1 and HDS–12.
- McCaig LF, Burt CW. National Hospital Ambulatory Medical Care Survey: 2001 emergency department summary. Advance Data from Vital and Health Statistics; no. 335
- National Center for Health Statistics. 2008 National Ambulatory Medical Care Survey. Public-use data file documentation. Hyattsville, MD. 2010.
- National Center for Health Statistics. Community health center data from the 2006–2008 National Ambulatory Medical Care Survey. Public-use data file documentation. Hyattsville, MD. Forthcoming.
- National Center for Health Statistics. 2008 National Hospital Ambulatory Medical Care Survey. Public-use data file documentation. Hyattsville, MD. 2010.
- SUDAAN, release 9.2 [computer software]. Research Triangle Park, NC: RTI International. 2009.

Suggested citation
Niska RW. Blood pressure measurements at emergency department visits by adults: United States, 2007–2008. NCHS data brief, no 72. Hyattsville, MD: National Center for Health Statistics. 2011.Copyright information
All material appearing in this report is in the public domain and may be reproduced or copied without permission; citation as to source, however, is appreciated.National Center for Health Statistics
Edward J. Sondik, Ph.D., DirectorJennifer H. Madans, Ph.D., Associate Director for Science
Division of Health Care Statistics
Jane E. Sisk, Ph.D., DirectorProducts - Data Brief - 72 - August 2011


.png)


No hay comentarios:
Publicar un comentario